Unlock a world of possibilities! Login now and discover the exclusive benefits awaiting you.
- Qlik Community
- :
- All Forums
- :
- QlikView App Dev
- :
- font size inside the plot segment value
- Subscribe to RSS Feed
- Mark Topic as New
- Mark Topic as Read
- Float this Topic for Current User
- Bookmark
- Subscribe
- Mute
- Printer Friendly Page
- Mark as New
- Bookmark
- Subscribe
- Mute
- Subscribe to RSS Feed
- Permalink
- Report Inappropriate Content
font size inside the plot segment value
Hi all,
In my expression i have clicked the plus symbol (expand option) i have used the text format as bold , now i want to increase the font size in the plot segment values of the bar, how to achieve it,.i have used font option but the x axis also expanding the with that, i want only the values inside bar have to be expanded how to do this in the expresiion
- « Previous Replies
-
- 1
- 2
- Next Replies »
- Mark as New
- Bookmark
- Subscribe
- Mute
- Subscribe to RSS Feed
- Permalink
- Report Inappropriate Content
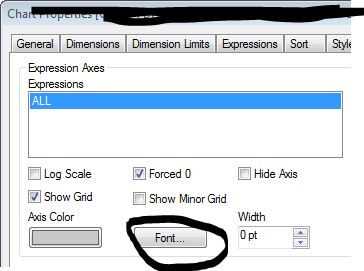
Go to "Axes" tab, Select the expression >> Click on Font and change the font size here
If a post helps to resolve your issue, please accept it as a Solution.
- Mark as New
- Bookmark
- Subscribe
- Mute
- Subscribe to RSS Feed
- Permalink
- Report Inappropriate Content
When I do this the x axis scale value font also being increased. i wan to avoid the x axis font to be same and data count displaying inside the segments have to be increased
- Mark as New
- Bookmark
- Subscribe
- Mute
- Subscribe to RSS Feed
- Permalink
- Report Inappropriate Content
can you share a sample app?
If a post helps to resolve your issue, please accept it as a Solution.
- Mark as New
- Bookmark
- Subscribe
- Mute
- Subscribe to RSS Feed
- Permalink
- Report Inappropriate Content
In test file the bar chart value as 200 it has to be bold and then font size have to be in 12
- Mark as New
- Bookmark
- Subscribe
- Mute
- Subscribe to RSS Feed
- Permalink
- Report Inappropriate Content
May be try this
Having display option 'values on data points' disabled, create a 'Show value' attribute expression for your bar expression (open the attributes by clicking on the small plus sign):
=If(Sum(Value)>100,1,0)
- Mark as New
- Bookmark
- Subscribe
- Mute
- Subscribe to RSS Feed
- Permalink
- Report Inappropriate Content
nothing is happened , pls tell me onl;y how to increase only the bar value inside segements data points font has to be increased
- Mark as New
- Bookmark
- Subscribe
- Mute
- Subscribe to RSS Feed
- Permalink
- Report Inappropriate Content
Hi Monaoranjan,
try this options ,
In chart porperties-> Axese tab->primary axes -> change the font size and style in it.
Hopes this help for you.
- Mark as New
- Bookmark
- Subscribe
- Mute
- Subscribe to RSS Feed
- Permalink
- Report Inappropriate Content
i tried this but when i do this why the y axis scale also being bold with huge font size, i need only the value in the bar chart has to be increased other than that shd be same
- Mark as New
- Bookmark
- Subscribe
- Mute
- Subscribe to RSS Feed
- Permalink
- Report Inappropriate Content
Kumar or vinneeth can any one reply me, is this qlikview behave like this? or this is draw back in qlikview
- « Previous Replies
-
- 1
- 2
- Next Replies »