Unlock a world of possibilities! Login now and discover the exclusive benefits awaiting you.
- Qlik Community
- :
- All Forums
- :
- QlikView App Dev
- :
- formatting and sorting issues in a pivot table.......
- Subscribe to RSS Feed
- Mark Topic as New
- Mark Topic as Read
- Float this Topic for Current User
- Bookmark
- Subscribe
- Mute
- Printer Friendly Page
- Mark as New
- Bookmark
- Subscribe
- Mute
- Subscribe to RSS Feed
- Permalink
- Report Inappropriate Content
formatting and sorting issues in a pivot table....urgent
 hi
hi
i have created a pivot table in my report and i have used two dimensions in it. the second dimension has been created by concatenating two dimensions
and i have transposed the second dimension to make CYjan,CY mar etc
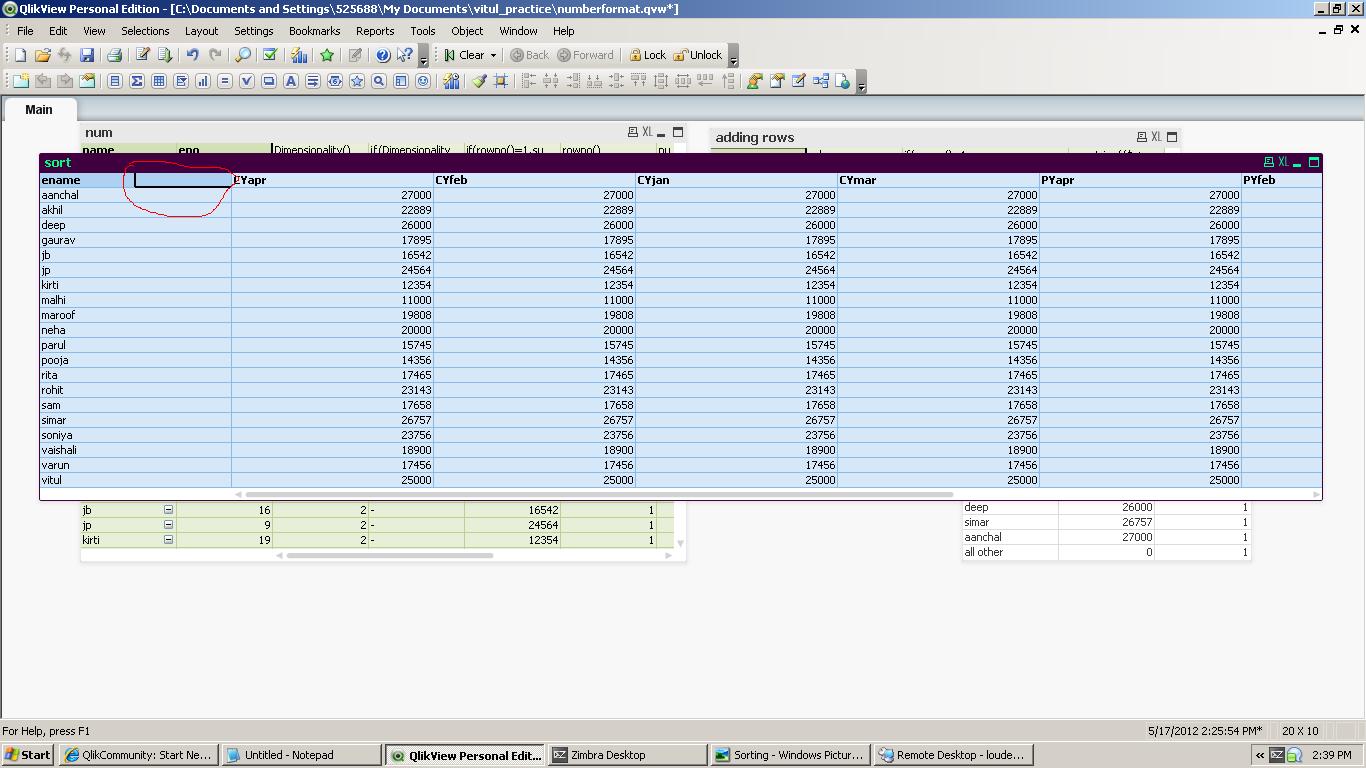
the first issue i am facing is the Black colour L shape figured (circled by red colour).
and the second issue is of sorting the header for my columns...
i want to display PYjan,PY feb,PY mar,PY apr,CY jan,CY feb,CY mar,CY apr but how to achieve that??
- Mark as New
- Bookmark
- Subscribe
- Mute
- Subscribe to RSS Feed
- Permalink
- Report Inappropriate Content
The two issues are related. When you create a dynamic dimension (like you have done here) you need to give it a label in the dimension tab. This label will be in the ringed black box. If you then go to the sort tab you will see your new label - click on it and choose how you want the month dimension sorted. (I guess you have created the dimension by ='CY' & Month, so sort by numeric ascending and you should be good to go.)
Hope this helps,
Jason
- Mark as New
- Bookmark
- Subscribe
- Mute
- Subscribe to RSS Feed
- Permalink
- Report Inappropriate Content
could you plz tell me how to handle that L shape figure which i had circled withred colour?/?
- Mark as New
- Bookmark
- Subscribe
- Mute
- Subscribe to RSS Feed
- Permalink
- Report Inappropriate Content
Sorry, no. There is another thread open about this same subject.
- Mark as New
- Bookmark
- Subscribe
- Mute
- Subscribe to RSS Feed
- Permalink
- Report Inappropriate Content
I agree with Jason.. that L shape thing is basically a box to to display the label for the transposed dimension.
So there is no way to take it out. But what's wrong in giving a dimension label there? like e.g. "Period" in your case.
- Mark as New
- Bookmark
- Subscribe
- Mute
- Subscribe to RSS Feed
- Permalink
- Report Inappropriate Content
this is the requirement of the customer for whom i am developing the reports.......plz tell me if there is any way to hide it or remove it???