Unlock a world of possibilities! Login now and discover the exclusive benefits awaiting you.
- Qlik Community
- :
- All Forums
- :
- QlikView App Dev
- :
- graph formatting
- Subscribe to RSS Feed
- Mark Topic as New
- Mark Topic as Read
- Float this Topic for Current User
- Bookmark
- Subscribe
- Mute
- Printer Friendly Page
- Mark as New
- Bookmark
- Subscribe
- Mute
- Subscribe to RSS Feed
- Permalink
- Report Inappropriate Content
graph formatting
Hello Guys,
Hope this finds you well.
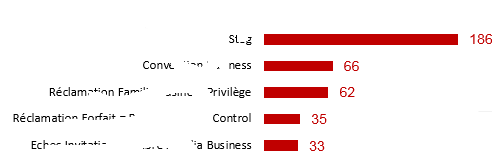
One of my users asked me to create a graph with the same formatting of the ghraph bellow :
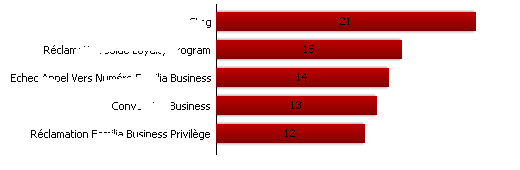
The graph that I made with Qlik :
I need to delete the axe between the dimension and values and change the position of the values on bars.
Any idea?
Thanks a lot
Accepted Solutions
- Mark as New
- Bookmark
- Subscribe
- Mute
- Subscribe to RSS Feed
- Permalink
- Report Inappropriate Content
By default there is no line between dimension values and bars. The values can be added on top of bar with a second expression. See attached sample for example.
- Mark as New
- Bookmark
- Subscribe
- Mute
- Subscribe to RSS Feed
- Permalink
- Report Inappropriate Content
Bar graph
Properties-->Style-->Orientation
- Mark as New
- Bookmark
- Subscribe
- Mute
- Subscribe to RSS Feed
- Permalink
- Report Inappropriate Content
This looks like a normal bar chart with values on data points added on the Expressions tab and the orientation changed in the Style tab.
Have you tried this?
- Mark as New
- Bookmark
- Subscribe
- Mute
- Subscribe to RSS Feed
- Permalink
- Report Inappropriate Content
Hi
Change Horizontal bars under Style tab
Properties>Style>Orientation>Horizontal bars
Presentation>Values on Data Points> Uncheck Plot values inside segments
Axes>Keep width = 0
HTH
- Mark as New
- Bookmark
- Subscribe
- Mute
- Subscribe to RSS Feed
- Permalink
- Report Inappropriate Content
By default there is no line between dimension values and bars. The values can be added on top of bar with a second expression. See attached sample for example.
- Mark as New
- Bookmark
- Subscribe
- Mute
- Subscribe to RSS Feed
- Permalink
- Report Inappropriate Content
Uncheck this:

- Mark as New
- Bookmark
- Subscribe
- Mute
- Subscribe to RSS Feed
- Permalink
- Report Inappropriate Content

and make width 0
- Mark as New
- Bookmark
- Subscribe
- Mute
- Subscribe to RSS Feed
- Permalink
- Report Inappropriate Content
Also, change the look,
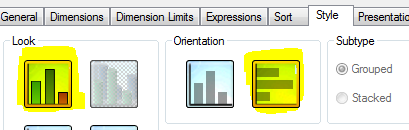
So, in total make 3 changes:
1. Properties-->Style-->Look
2. Properties-->Style-->Orientation
3. Properties-->Presentation-->values on data points-->Plot values inside segments (Uncheck)
- Mark as New
- Bookmark
- Subscribe
- Mute
- Subscribe to RSS Feed
- Permalink
- Report Inappropriate Content
Thanks Toni and Varsha