Unlock a world of possibilities! Login now and discover the exclusive benefits awaiting you.
- Qlik Community
- :
- All Forums
- :
- QlikView App Dev
- :
- graphic with lines with field "year" on dimension ...
- Subscribe to RSS Feed
- Mark Topic as New
- Mark Topic as Read
- Float this Topic for Current User
- Bookmark
- Subscribe
- Mute
- Printer Friendly Page
- Mark as New
- Bookmark
- Subscribe
- Mute
- Subscribe to RSS Feed
- Permalink
- Report Inappropriate Content
graphic with lines with field "year" on dimension and expression
Hello,
i'm new user of qlik.
I have already one problem with qlik.
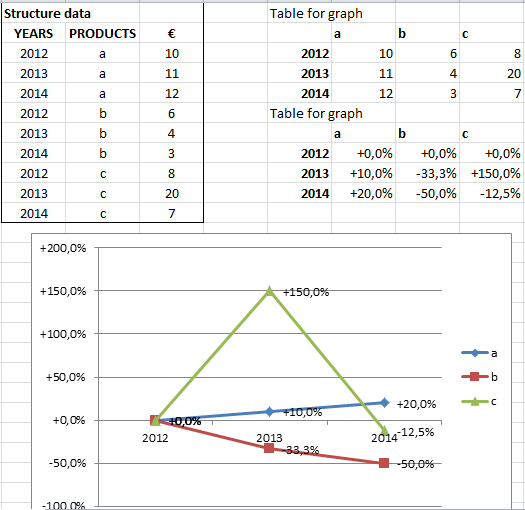
i'm loading a table with these columns: years (example: 2012, 2013, 2014), products (example: a,b,c), import € (1, 2, 3)
i want create a graphic with lines. this graphic have to illustrate the dimension "years" in axis x and the % change of € between every years with last year in y axis (example: € 2014 - € 2012 in year 2014, € 2013 - € 2012 in year 2013).
i'm thinking to replicate the "€" column in the load script but i hope to find another solution with your help.
How i can do?
thanks
Francesco
- Mark as New
- Bookmark
- Subscribe
- Mute
- Subscribe to RSS Feed
- Permalink
- Report Inappropriate Content
You can see this:
- Mark as New
- Bookmark
- Subscribe
- Mute
- Subscribe to RSS Feed
- Permalink
- Report Inappropriate Content
I don't find the solution in link posted.
I show that i want in this graph.
Can you help me?
Thanks
Francesco