Unlock a world of possibilities! Login now and discover the exclusive benefits awaiting you.
- Qlik Community
- :
- All Forums
- :
- QlikView App Dev
- :
- grouping
- Subscribe to RSS Feed
- Mark Topic as New
- Mark Topic as Read
- Float this Topic for Current User
- Bookmark
- Subscribe
- Mute
- Printer Friendly Page
- Mark as New
- Bookmark
- Subscribe
- Mute
- Subscribe to RSS Feed
- Permalink
- Report Inappropriate Content
grouping
how can we convert this chart
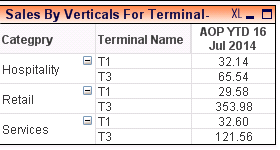
into
Accepted Solutions
- Mark as New
- Bookmark
- Subscribe
- Mute
- Subscribe to RSS Feed
- Permalink
- Report Inappropriate Content
Yes !!, I got the solution 
Using pivot table
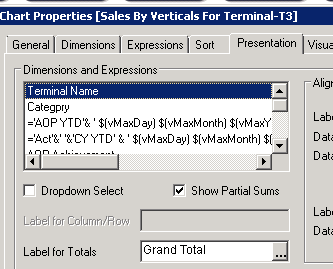
take-terminal as 1st dimension then check show partial sum for both terminal and category & for terminal write grand total in label tab and for category write total in label
- Mark as New
- Bookmark
- Subscribe
- Mute
- Subscribe to RSS Feed
- Permalink
- Report Inappropriate Content
Hi,
You can change the sequence of the dimension.
In Dimension tab take Terminal on top and then second one should be business.
Regards,
Kaushik Solanki
- Mark as New
- Bookmark
- Subscribe
- Mute
- Subscribe to RSS Feed
- Permalink
- Report Inappropriate Content
hi
simply take a straight table. then get the desired result. hope this helps you.
- Mark as New
- Bookmark
- Subscribe
- Mute
- Subscribe to RSS Feed
- Permalink
- Report Inappropriate Content
Thanks, but i tried that it result in
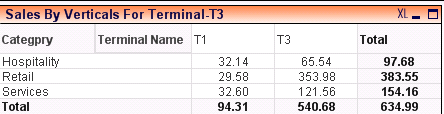

but i want that grand total should be display in the bottom. i.e.634.99 & i will not display 97.68 ,383.55,154.16
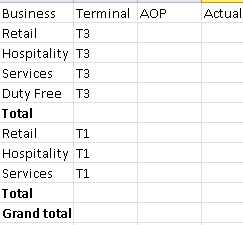
Can't we display the chart in same same format as required by user( as mentioned in excel attachment)
- Mark as New
- Bookmark
- Subscribe
- Mute
- Subscribe to RSS Feed
- Permalink
- Report Inappropriate Content
how?
- Mark as New
- Bookmark
- Subscribe
- Mute
- Subscribe to RSS Feed
- Permalink
- Report Inappropriate Content
plz reply asap
- Mark as New
- Bookmark
- Subscribe
- Mute
- Subscribe to RSS Feed
- Permalink
- Report Inappropriate Content
Hi Sweta
Instead of using Pivot Table just click on straight table...
That should do the trick...
- Mark as New
- Bookmark
- Subscribe
- Mute
- Subscribe to RSS Feed
- Permalink
- Report Inappropriate Content
Dear Shweta,
In the general tab of you pivot select straight table which appears below the pivot. Also looks like in your image you are sorting by terminal. If that is correct go to sort and promote terminal over business. This should give you what you want.
Regards
Rahul
- Mark as New
- Bookmark
- Subscribe
- Mute
- Subscribe to RSS Feed
- Permalink
- Report Inappropriate Content
Yes !!, I got the solution
Using pivot table
take-terminal as 1st dimension then check show partial sum for both terminal and category & for terminal write grand total in label tab and for category write total in label