Unlock a world of possibilities! Login now and discover the exclusive benefits awaiting you.
- Qlik Community
- :
- All Forums
- :
- QlikView App Dev
- :
- help with Pivot
- Subscribe to RSS Feed
- Mark Topic as New
- Mark Topic as Read
- Float this Topic for Current User
- Bookmark
- Subscribe
- Mute
- Printer Friendly Page
- Mark as New
- Bookmark
- Subscribe
- Mute
- Subscribe to RSS Feed
- Permalink
- Report Inappropriate Content
help with Pivot
Hi,
I am using a pivot in one of my apps. Wanted to know if the following is possible.
I want a new column for the percentages to be displayed in pivot like in following image.
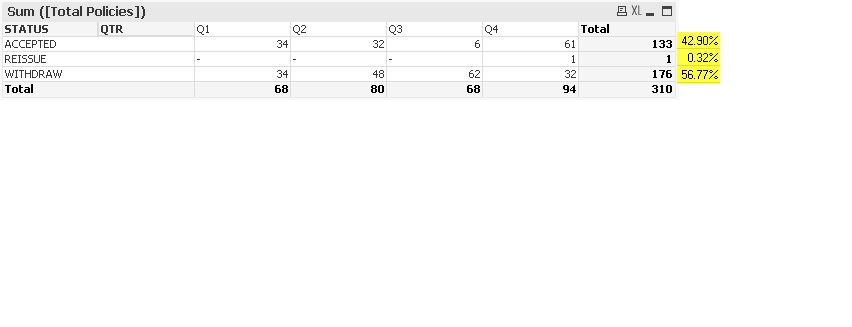
133/310*100= 42.9%
1/310*100= 0.32%
176/310*100=56.77%
Please advise if this is possible in pivot.(Attached is the qvw and excel with test data)
Thanks in advance
Accepted Solutions
- Mark as New
- Bookmark
- Subscribe
- Mute
- Subscribe to RSS Feed
- Permalink
- Report Inappropriate Content
May be like this:
LOAD YEAR,
QTR,
STATUS,
[Total Policies]
FROM
(ooxml, embedded labels, table is Sheet1);
LOAD * Inline [
Dim
1
2
3
];
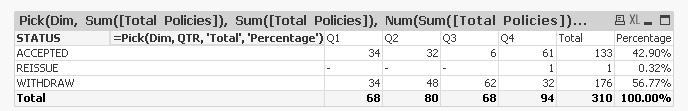
Pivot Table
Dimension
1) STATUS
2) =Pick(Dim, QTR, 'Total', 'Percentage')
Expressions
Pick(Dim, Sum([Total Policies]), Sum([Total Policies]), Num(Sum([Total Policies])/Sum(TOTAL [Total Policies]), '##.##%'))
- Mark as New
- Bookmark
- Subscribe
- Mute
- Subscribe to RSS Feed
- Permalink
- Report Inappropriate Content
I don't think it is possible with Pivot chart, But it is possible with Straight Table. See the attached file:
Hope this helps...
- Mark as New
- Bookmark
- Subscribe
- Mute
- Subscribe to RSS Feed
- Permalink
- Report Inappropriate Content
May be like this:
LOAD YEAR,
QTR,
STATUS,
[Total Policies]
FROM
(ooxml, embedded labels, table is Sheet1);
LOAD * Inline [
Dim
1
2
3
];
Pivot Table
Dimension
1) STATUS
2) =Pick(Dim, QTR, 'Total', 'Percentage')
Expressions
Pick(Dim, Sum([Total Policies]), Sum([Total Policies]), Num(Sum([Total Policies])/Sum(TOTAL [Total Policies]), '##.##%'))