Unlock a world of possibilities! Login now and discover the exclusive benefits awaiting you.
- Qlik Community
- :
- All Forums
- :
- QlikView App Dev
- :
- help with count
- Subscribe to RSS Feed
- Mark Topic as New
- Mark Topic as Read
- Float this Topic for Current User
- Bookmark
- Subscribe
- Mute
- Printer Friendly Page
- Mark as New
- Bookmark
- Subscribe
- Mute
- Subscribe to RSS Feed
- Permalink
- Report Inappropriate Content
help with count
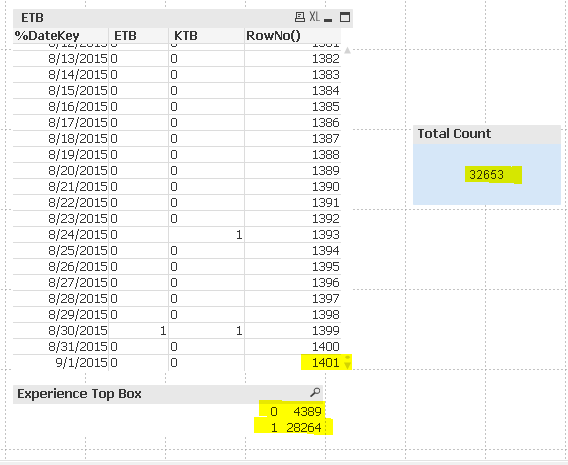
I have a single table loaded, trying to reconcile the counts that are showing in my list box, with what my chart is actually displaying,
The number do not add up - what am I missing.
The total records in this table is 32653.
When I print out the rowno() the max it is displaying is 1401.
My list box shows the count of the frequency of the values which matches up to my totals.
😞
- Tags:
- display count
- Mark as New
- Bookmark
- Subscribe
- Mute
- Subscribe to RSS Feed
- Permalink
- Report Inappropriate Content
Hi,
Please use these two expressions in text boxes and see the results.
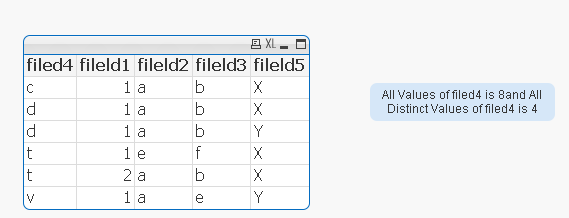
='All Values of ETB is ' &Count(ETB) &
'and '
& 'All Distinct Values of ETBis ' &Count(DISTINCT ETB)
='All Values of KTB is ' &Count(KTB) &
'and '
& 'All Distinct Values of KTBis ' &Count(DISTINCT KTB)
FYI, I enclosed test file with the data.
Hope you will understand.
- Mark as New
- Bookmark
- Subscribe
- Mute
- Subscribe to RSS Feed
- Permalink
- Report Inappropriate Content
Hi,
Add RowNo() field as a dimension and see the result. I guess, %Datekey must contains replicated entries. Could you explain your exact requirement.?
- Mark as New
- Bookmark
- Subscribe
- Mute
- Subscribe to RSS Feed
- Permalink
- Report Inappropriate Content
You are asking to see what's going on in your script. It might help if you posted it here.
- Mark as New
- Bookmark
- Subscribe
- Mute
- Subscribe to RSS Feed
- Permalink
- Report Inappropriate Content
Hi,
try with TOTAL keyword.
Regards
Please appreciate our Qlik community members by giving Kudos for sharing their time for your query. If your query is answered, please mark the topic as resolved 🙂
- Mark as New
- Bookmark
- Subscribe
- Mute
- Subscribe to RSS Feed
- Permalink
- Report Inappropriate Content
Hi Gerry,
Do you have any where condition with that table? if so RowNo( ) cannot be used....please use RecNo( ) this should resolve the issue