Unlock a world of possibilities! Login now and discover the exclusive benefits awaiting you.
- Qlik Community
- :
- All Forums
- :
- QlikView App Dev
- :
- how I can design table in qlikview
- Subscribe to RSS Feed
- Mark Topic as New
- Mark Topic as Read
- Float this Topic for Current User
- Bookmark
- Subscribe
- Mute
- Printer Friendly Page
- Mark as New
- Bookmark
- Subscribe
- Mute
- Subscribe to RSS Feed
- Permalink
- Report Inappropriate Content
how I can design table in qlikview
Dear All:
Good morning
plz help me to design like this table in Qlikview
1. I can't create column 5 & 9 ( As total 3 month sales.
2. I can't create column 10 11 and 12 ( as additional column not under my dimensions Year&Month.
ur support and help highly appreciated,
| 1 | 2 | 3 | 4 | 5 | 6 | 7 | 8 | 9 | 10 | 11 | 12 |
| CompanyName | 2015 Sales Amnt | 2016 Sales Amnt | vs Target | vs TTL 2016 | 16 vs 15 | ||||||
| Jan | Feb | Mar | Q1 | Jan | Feb | Mar | Q1 | ||||
| Company 01 | 40,743,373 | 47,837,632 | 63,312,328 | 151,893,333 | 40,280,917 | 51,705,409 | 85,896,975 | 177,883,301 | 108% | 24% | 117% |
| Company 02 | 15,895,881 | 21,559,914 | 34,121,324 | 71,577,119 | 15,687,747 | 23,690,789 | 42,218,584 | 81,597,120 | 101% | 23% | 114% |
| Company 03 | 728,640 | 3,683,913 | 3,828,799 | 8,241,352 | 2,282,356 | 1,106,162 | 1,787,337 | 5,175,855 | 42% | 9% | 63% |
| Company 04 | 1,204,970 | 1,216,071 | 1,347,074 | 3,768,115 | 1,207,288 | 1,248,926 | 1,227,244 | 3,683,458 | 83% | 17% | 98% |
| Total | 58,572,864 | 74,297,530 | 102,609,526 | 235,479,920 | 59,458,309 | 77,751,286 | 131,130,140 | 268,339,735 | 102% | 23% | 114% |
- Mark as New
- Bookmark
- Subscribe
- Mute
- Subscribe to RSS Feed
- Permalink
- Report Inappropriate Content
no answer.....
plz help
- Mark as New
- Bookmark
- Subscribe
- Mute
- Subscribe to RSS Feed
- Permalink
- Report Inappropriate Content
You could create columns 5 and 9 by creating a new field in the script and use that as dimension:
NewTable:
LOAD * INLINE [
Period, Month
Jan, Jan
Feb, Feb
Mar, Mar
Q1, Jan
Q1. Feb
Q1, Mar
];
But I don't think you can create columns 10,11 and 12 this way. An alternative is to use a straight table instead of a pivot table and add twelve expressions, one for each column. You'll have to use text boxes for the headers like '2015 Sales Amnt' and '2016 Sales Amnt' because a straight table can have only one header row.
Column 1,2,3,4,6,7 would be something like sum({<Year={2015},Month={Jan}>}Value). Column 5 would be something like rangesum(Column(1),Column(2),Column(3). I can't tell you the expressions for the last three columns because I have no idea from what data they should be calculated
talk is cheap, supply exceeds demand
- Mark as New
- Bookmark
- Subscribe
- Mute
- Subscribe to RSS Feed
- Permalink
- Report Inappropriate Content
thanks for replay (Gysbet )..
but all what I need simple table
- compare between tow selected year for selected month's
- and column total for each year beside month column
- and three additional column for another formula calculation.
any one can easy create this table on simple Excel but not possible on professional BI like Qlikview....???!!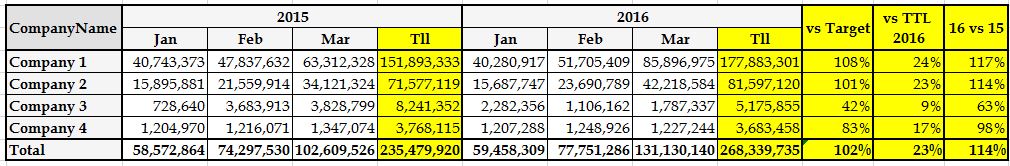
- Mark as New
- Bookmark
- Subscribe
- Mute
- Subscribe to RSS Feed
- Permalink
- Report Inappropriate Content
Hi
It is possible.
Firstly, are you only displaying 3 months for each year at a time and how are you forcing this via selections?
If its a static 3 months then you could use set analysis. OR, there is also a QV function called GetFieldSelection(FieldName) which you can then use to embed into set analysis if the 3 months and year's are to be dynamic.
- Mark as New
- Bookmark
- Subscribe
- Mute
- Subscribe to RSS Feed
- Permalink
- Report Inappropriate Content
Better you can use Cross Table to Create a Table for this kind of Data
- Mark as New
- Bookmark
- Subscribe
- Mute
- Subscribe to RSS Feed
- Permalink
- Report Inappropriate Content
I apologize from all..
But sometimes i have more than 3 month's or less ( Depend on my selections )
and also I can't use Gross table to create my simple table 
- Mark as New
- Bookmark
- Subscribe
- Mute
- Subscribe to RSS Feed
- Permalink
- Report Inappropriate Content
Hi,
Can you provide your sample data format that helps to solve the issue.
-Hirish
- Mark as New
- Bookmark
- Subscribe
- Mute
- Subscribe to RSS Feed
- Permalink
- Report Inappropriate Content
My data