Unlock a world of possibilities! Login now and discover the exclusive benefits awaiting you.
- Qlik Community
- :
- All Forums
- :
- QlikView App Dev
- :
- how the data should look like to be useful ?
- Subscribe to RSS Feed
- Mark Topic as New
- Mark Topic as Read
- Float this Topic for Current User
- Bookmark
- Subscribe
- Mute
- Printer Friendly Page
- Mark as New
- Bookmark
- Subscribe
- Mute
- Subscribe to RSS Feed
- Permalink
- Report Inappropriate Content
how the data should look like to be useful ?
how the data should look like to be useful ?
- Tags:
- new_to_qlikview
- « Previous Replies
-
- 1
- 2
- Next Replies »
- Mark as New
- Bookmark
- Subscribe
- Mute
- Subscribe to RSS Feed
- Permalink
- Report Inappropriate Content
Not if ALL the fields are the same in both loads, this will auto concatenate into a single table, with some same named fields though yes you are right, the result will be synthetic keys on those fields
- Mark as New
- Bookmark
- Subscribe
- Mute
- Subscribe to RSS Feed
- Permalink
- Report Inappropriate Content
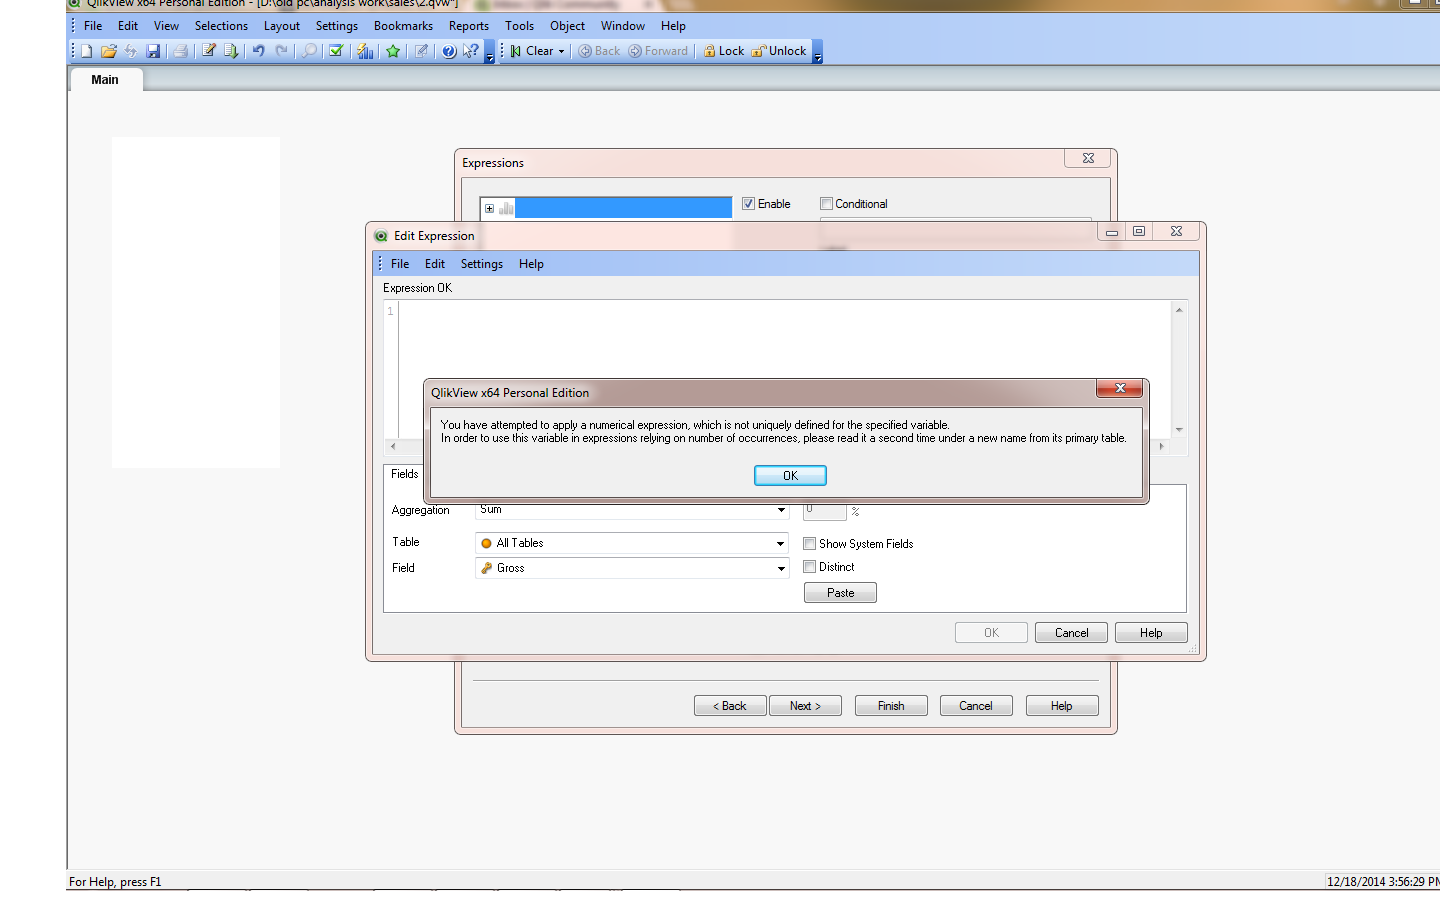
ok now i load the data - i hope correctly - i'm trying to make chart after defining dimension and in edit expression it give me this .
what is that mean ?
- Mark as New
- Bookmark
- Subscribe
- Mute
- Subscribe to RSS Feed
- Permalink
- Report Inappropriate Content
some how it's good now, but still bar chart show me the sum of both years for one the customer, when i try to add expression i face the same meassage ( the previous post ),
thanks.
- Mark as New
- Bookmark
- Subscribe
- Mute
- Subscribe to RSS Feed
- Permalink
- Report Inappropriate Content
Which expression you are trying to write there.
- Mark as New
- Bookmark
- Subscribe
- Mute
- Subscribe to RSS Feed
- Permalink
- Report Inappropriate Content
Dear Mohamed EI,
Here are the expressions,
Current year expression:
Sum ({$<Year = {$(=Only(Year))}>} Gross)
Previous year expression:
Sum ({$<Year = {$(=Only(Year)-1)}>} Gross)
Next year expression:
Sum ({$<Year = {$(=Only(Year)+1)}>} Gross)
Kind regards,
Ishfaque Ahmed
- Mark as New
- Bookmark
- Subscribe
- Mute
- Subscribe to RSS Feed
- Permalink
- Report Inappropriate Content
MoM and YoY Trends are the most useful added with comparing the data with LY MoM or LY YoY trends.
% increase and Decrease compared to Last Year or Last Month
Sit with business users and understand what they want to look at, and try to create visualization accordingly.
- Mark as New
- Bookmark
- Subscribe
- Mute
- Subscribe to RSS Feed
- Permalink
- Report Inappropriate Content
Hi Ishfaque,
Can you please give the simple set analysis code for YTD,QTD,MTD,LYTD,LQTD,LMTD and YoY,QoQ,MoM.
Waiting for your reply
Thanks
Prashant.
- Mark as New
- Bookmark
- Subscribe
- Mute
- Subscribe to RSS Feed
- Permalink
- Report Inappropriate Content
Dear Mohamed EI,
I recommended you Rob Wunderlich - QlikView components for most of the things, here is the link just download and enjoy.
https://github.com/RobWunderlich/Qlikview-Components
Kind regards,
Ishfaque Ahmed
- Mark as New
- Bookmark
- Subscribe
- Mute
- Subscribe to RSS Feed
- Permalink
- Report Inappropriate Content
appreciate ishafque Ahmed your replya and interesting, sorry i couldn't replay you the last couple days, it's the week-end here in KSA, i'll try your advise, thanks alot
- Mark as New
- Bookmark
- Subscribe
- Mute
- Subscribe to RSS Feed
- Permalink
- Report Inappropriate Content
thanks every boudy for your comments, appreciate.
- « Previous Replies
-
- 1
- 2
- Next Replies »