Unlock a world of possibilities! Login now and discover the exclusive benefits awaiting you.
- Qlik Community
- :
- All Forums
- :
- QlikView App Dev
- :
- how to achieve this....??
- Subscribe to RSS Feed
- Mark Topic as New
- Mark Topic as Read
- Float this Topic for Current User
- Bookmark
- Subscribe
- Mute
- Printer Friendly Page
- Mark as New
- Bookmark
- Subscribe
- Mute
- Subscribe to RSS Feed
- Permalink
- Report Inappropriate Content
how to achieve this....??
Hi all
Hi all,
I have some data in database then How to display the below tables in qlikview.plz suggest me the best way and discribe the process in disussion window only.i using personal edition,so plz help me this part.
thanks in advance.
| student | subject | attan... |
| ramu | xxx | 29 |
| yyy | 70 | |
| zzz | 60 | |
| raju | xxx | 36 |
| yyy | 80 | |
| zzz | 60 |
legend:
| legend: | ||
| grade | danger zone | <40% |
| better | 60% | |
| good | >70% |
- Tags:
- new_to_qlikview
- subbu
- Mark as New
- Bookmark
- Subscribe
- Mute
- Subscribe to RSS Feed
- Permalink
- Report Inappropriate Content
To the expression, add a Background color (expand the expression tree) and test the same expression value for your ranges. Imagine that you display sum(Sales), then the background color expression becomes something like:
=if (sum(Sales) < 40, green(), if (sum(Amount) > 70, red(), blue()))
:
- Mark as New
- Bookmark
- Subscribe
- Mute
- Subscribe to RSS Feed
- Permalink
- Report Inappropriate Content
Replace sum(Sales) with your actual expression. Percentages can be compared with fractions, like 0.4, 0.6 and 0.7
Check the Color functions page in QV Desktop help for more information aboutr the different functions, like lightgrey() and such.
- Mark as New
- Bookmark
- Subscribe
- Mute
- Subscribe to RSS Feed
- Permalink
- Report Inappropriate Content
Hi peter,
The tables represented in excel.In qlikview which objects are used to generate the above table as same in qlikview with legends.plz tell me.
- Mark as New
- Bookmark
- Subscribe
- Mute
- Subscribe to RSS Feed
- Permalink
- Report Inappropriate Content
Use pivot table multi-dimensional
- Mark as New
- Bookmark
- Subscribe
- Mute
- Subscribe to RSS Feed
- Permalink
- Report Inappropriate Content
Hi @subbu jasti,
You can achieve the above table using Pivot Table in qlikview and specifying Visual Cues as required.
It is not possible in qlikview to display legend along with Pivot Table. You can create a separate text box indicating the same very easily.
Or another alternative could be that you could add a help text by going into the Caption tab of pivot table properties.
But in your case Text box would serve the purpose correctly.
In order to create a pivot table:
I guess you have an excel sheet with columns as- student,subject and attendance
Create a new chart->select pivot table->in dimensions add student and subject-> then in expressions "sum(attendance)",
then specify visual cues as required by selecting color and range.
Hope it helps.:)
- Mark as New
- Bookmark
- Subscribe
- Mute
- Subscribe to RSS Feed
- Permalink
- Report Inappropriate Content
For the main table, use a Pivot with one expression and two dimensions (student & subject). Add the coloring trick to the expression background color.
A Pivot table does not have a legend, so you will have to simulate one by designing an artificial legend in another pivot table. create an inline table with dummy values (three rows with green in the first column, danger zone/better/good in the second and the other texts in the third.) Add a pivot table with these values as data, and the same coloring trick to the background color. Make sure that the legend pivot has not links whatsoever to any of the other tables.
See Gysbert's document in this discussion: http://community.qlik.com/message/293470#293470 The legend on top of the big bar chart is a simulated legend. Look at the object properties to figure out how it's done.
Best,
Peter
- Mark as New
- Bookmark
- Subscribe
- Mute
- Subscribe to RSS Feed
- Permalink
- Report Inappropriate Content
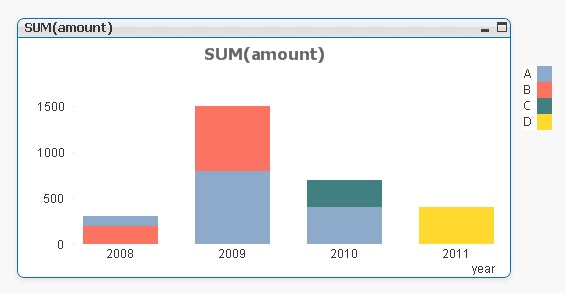
Sorry, just saw you mentioned PE-edition only. This is what the example looks like, after I moved the artificial legend to the right:

The straight table-doing-a-legend uses a single dimension (customer), a single expression (=1) and this expression in the background color settings:
=pick(match(customer,'A','B','C','D'),color(1),color(2),color(3),color(4))