Unlock a world of possibilities! Login now and discover the exclusive benefits awaiting you.
- Qlik Community
- :
- All Forums
- :
- QlikView App Dev
- :
- how to add dummy values to charts?
- Subscribe to RSS Feed
- Mark Topic as New
- Mark Topic as Read
- Float this Topic for Current User
- Bookmark
- Subscribe
- Mute
- Printer Friendly Page
- Mark as New
- Bookmark
- Subscribe
- Mute
- Subscribe to RSS Feed
- Permalink
- Report Inappropriate Content
how to add dummy values to charts?
i have created charts which show values by month, which has been restricted to show 5 months from the current month for various accounts. However, when a new account is added to the DB, which has values for the current month only, the chart will show the same.
is it possible to get the chart to show the previous 5 months with 0 values ?
- Tags:
- chart
- Mark as New
- Bookmark
- Subscribe
- Mute
- Subscribe to RSS Feed
- Permalink
- Report Inappropriate Content
Hi,
UNCHECK the suppress zero option in the presentation tab.
- Mark as New
- Bookmark
- Subscribe
- Mute
- Subscribe to RSS Feed
- Permalink
- Report Inappropriate Content
dimension is month.
expression is
=sum({<[Product]={'Desktop','Laptop''},Month={">=$(=addmonths(max(Month),-5)) <=$(=Max(Month))"}>}(amount))
so if uncheck the Supress Zero Values option it will show all the existing months.
- Mark as New
- Bookmark
- Subscribe
- Mute
- Subscribe to RSS Feed
- Permalink
- Report Inappropriate Content
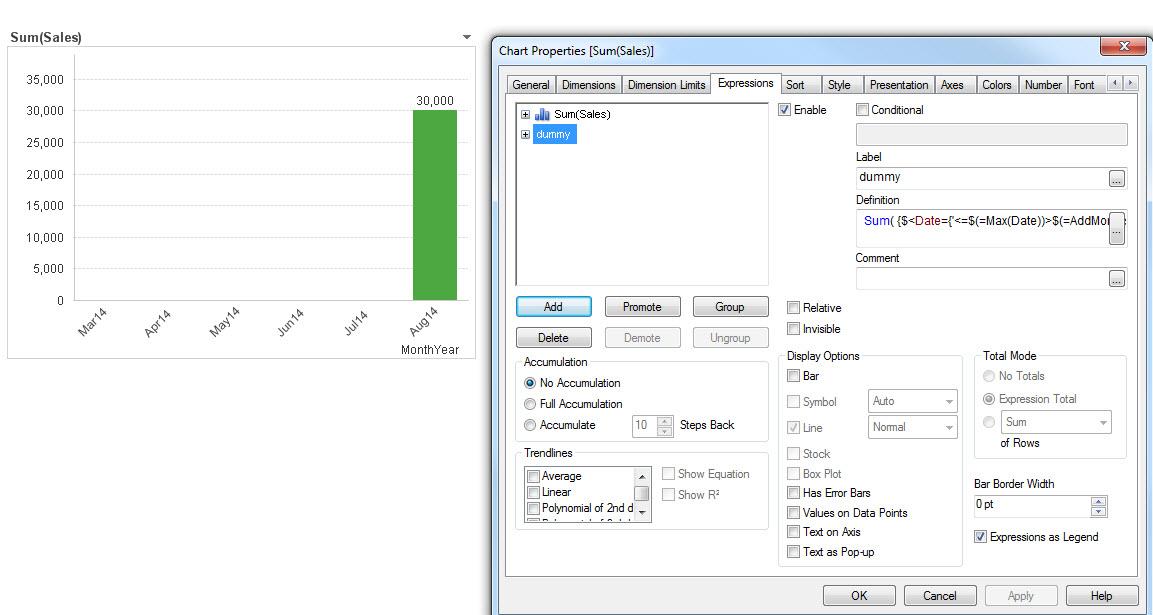
You can add a dummy expression (e.g. Sum(1)) to the chart and clear all checkboxes under 'Display Options'.
To restrict to show trailing 5 months, you can use set analysis like:
Sum( {$<Date={'<=$(=Max(Date))>$(=AddMonths(Max(Date), -5))'}, Year=, Quarter=, Month=, MonthYear=>} 1)
- Mark as New
- Bookmark
- Subscribe
- Mute
- Subscribe to RSS Feed
- Permalink
- Report Inappropriate Content
i m using a similar expression. not sure how to add the dummy expression.
revenue =sum({<[Product]={'Desktop','Laptop''},Year=,Quarter=,Month=,MonthYearNew={">=$(=addmonths(max(MonthYearNew),-5)) <=$(=Max(MonthYearNew))"}>}(amount))
this expression gives me the trailing 5 months. however when i select an account which is new and may not have the previous months data, it only ends up showing the existing month data only, not able to achieve the empty trailing months .
- Mark as New
- Bookmark
- Subscribe
- Mute
- Subscribe to RSS Feed
- Permalink
- Report Inappropriate Content
Yes, in Dimension select show all value and uncheck the suppress zero.
- Mark as New
- Bookmark
- Subscribe
- Mute
- Subscribe to RSS Feed
- Permalink
- Report Inappropriate Content
In my screenshot above, I only have actual data in 1 month. Therefore, the dummy expression ensures that 5 months plus current month still displays. To try it out in your chart, make a new expression and uncheck the Display Options so that it isn't shown (but still is calc'd).
e.g. sum({<[Product]={'Desktop','Laptop''},Year=,Quarter=,Month=,MonthYearNew={">=$(=addmonths(max(MonthYearNew),-5)) <=$(=Max(MonthYearNew))"}>} 1)
replace amount field with 1.
- Mark as New
- Bookmark
- Subscribe
- Mute
- Subscribe to RSS Feed
- Permalink
- Report Inappropriate Content
i did that , but i still do get the desired result.
it would be great if you could provide ( load) the QVW file that you showed in the example above.
- Mark as New
- Bookmark
- Subscribe
- Mute
- Subscribe to RSS Feed
- Permalink
- Report Inappropriate Content
See attached an an example. Thanks