Unlock a world of possibilities! Login now and discover the exclusive benefits awaiting you.
- Qlik Community
- :
- All Forums
- :
- QlikView App Dev
- :
- how to bring date in the table at the dimension le...
- Subscribe to RSS Feed
- Mark Topic as New
- Mark Topic as Read
- Float this Topic for Current User
- Bookmark
- Subscribe
- Mute
- Printer Friendly Page
- Mark as New
- Bookmark
- Subscribe
- Mute
- Subscribe to RSS Feed
- Permalink
- Report Inappropriate Content
how to bring date in the table at the dimension level.
HI All
I have a table with 2 columns as 'running_short_name' and 'running percent'.
running_short_name is a dimension. I have calculated the running percent using set expression for date as
sum({<MYDATE={"$(=max(MYDATE))"}>}count_good) / (sum({<MYDATE={"$(=max(MYDATE))"}>}count_good) + sum({<MYDATE={"$(=max(MYDATE))"}>}count_bad) )
i.e in a simple calculation it is as ---> sum(count_good) / sum(count_good) + sum(count_bad) for the latest date
and set the number format to show as percentage.
its a requirement to show running percent for the for the latest date, but running_short_name wise. i.e max date at running_short_name level
Now its good until i have the 'running short name' for the latest date. my percentage is shown correctly if the running_short_name has values for the latest date.
But if some of the values in the running_short_name has data for previous date or any older date than max date then the percent is shown as null.
now instead of showing null it should calculate the percentage for that date.(older date too) as we have many dates and running_short_name can have data for any date.
So i need to use the foreach function to calculate the percentage
like sum(count_good) for each running_short_name. How can i do that? is there any other way to achieve this?
Thanks
Ashish
Accepted Solutions
- Mark as New
- Bookmark
- Subscribe
- Mute
- Subscribe to RSS Feed
- Permalink
- Report Inappropriate Content
Use max(Date) to get the maximum date and use FirstSortedValue( aggr(sum(Failures),Name,Date), -aggr(Date,Date,Name)) to get the sum of failures for that maximum date.
talk is cheap, supply exceeds demand
- Mark as New
- Bookmark
- Subscribe
- Mute
- Subscribe to RSS Feed
- Permalink
- Report Inappropriate Content
Can you post a qlikview document that demonstrates the problem.
talk is cheap, supply exceeds demand
- Mark as New
- Bookmark
- Subscribe
- Mute
- Subscribe to RSS Feed
- Permalink
- Report Inappropriate Content
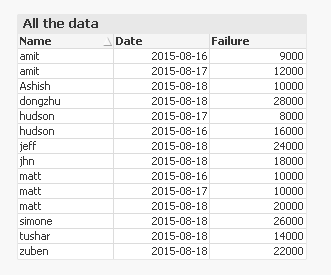
Hi
if i do not apply any formula in the expression and simply drag the objects i have the below data
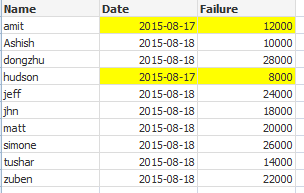
Now if I apply below expression for the failures column then i see below data
sum({<Date={"$(=max(Date))"}>}Failures)
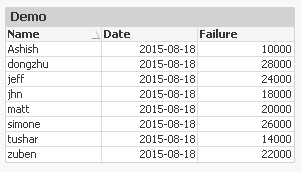
but what I want is max Date for each Name. I want to see the data like below.
how should the expression using set analysis be written.
- Mark as New
- Bookmark
- Subscribe
- Mute
- Subscribe to RSS Feed
- Permalink
- Report Inappropriate Content
Use max(Date) to get the maximum date and use FirstSortedValue( aggr(sum(Failures),Name,Date), -aggr(Date,Date,Name)) to get the sum of failures for that maximum date.
talk is cheap, supply exceeds demand
- Mark as New
- Bookmark
- Subscribe
- Mute
- Subscribe to RSS Feed
- Permalink
- Report Inappropriate Content
You can try this: get max date for each name and use this max date in your expression.
- Mark as New
- Bookmark
- Subscribe
- Mute
- Subscribe to RSS Feed
- Permalink
- Report Inappropriate Content
That worked perfectly