Unlock a world of possibilities! Login now and discover the exclusive benefits awaiting you.
- Qlik Community
- :
- All Forums
- :
- QlikView App Dev
- :
- how to compare current month sales and previous mo...
- Subscribe to RSS Feed
- Mark Topic as New
- Mark Topic as Read
- Float this Topic for Current User
- Bookmark
- Subscribe
- Mute
- Printer Friendly Page
- Mark as New
- Bookmark
- Subscribe
- Mute
- Subscribe to RSS Feed
- Permalink
- Report Inappropriate Content
how to compare current month sales and previous month sales?
Hi,
I want to compare current month and previous month in bar chart.what the expression need to write please help me.
Thanking you,
- Mark as New
- Bookmark
- Subscribe
- Mute
- Subscribe to RSS Feed
- Permalink
- Report Inappropriate Content
Hi Anji,
Do you mean you would want to see a graph that showed sales for example, for January to December?
Thanks
- Mark as New
- Bookmark
- Subscribe
- Mute
- Subscribe to RSS Feed
- Permalink
- Report Inappropriate Content
- Mark as New
- Bookmark
- Subscribe
- Mute
- Subscribe to RSS Feed
- Permalink
- Report Inappropriate Content
you will get number of stuff if you start search on Google
Create 2 expressions
1) Sum({<MonthFieldName = {'$(=Max(MonthFieldName))'}>}Sales)
2) Sum({<MonthFieldName = {'$(=AddMonths(Max(MonthFieldName),-1))'}>}Sales)
- Mark as New
- Bookmark
- Subscribe
- Mute
- Subscribe to RSS Feed
- Permalink
- Report Inappropriate Content
check this document
- Mark as New
- Bookmark
- Subscribe
- Mute
- Subscribe to RSS Feed
- Permalink
- Report Inappropriate Content
HI
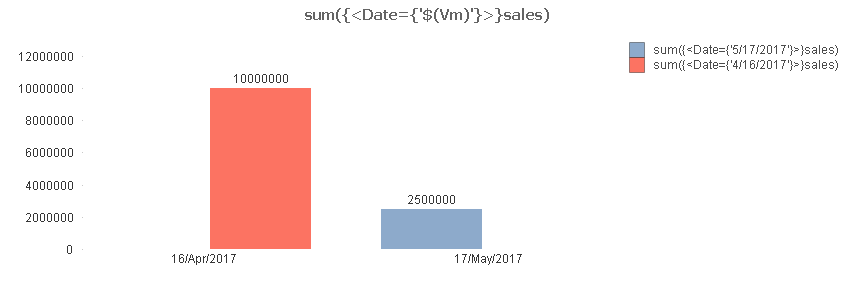
Expecting like this right
- Mark as New
- Bookmark
- Subscribe
- Mute
- Subscribe to RSS Feed
- Permalink
- Report Inappropriate Content
No Mathew this year data only
- Mark as New
- Bookmark
- Subscribe
- Mute
- Subscribe to RSS Feed
- Permalink
- Report Inappropriate Content
A single expression like this the. Let's use the example that you are looking at sales.
Sum({$<yourDate={'>=$(=MonthStart(AddMonths(Max('yourDate'),-1)))'}>}Sales)
That should do the trick. Only requires one measure and will show you the latest month's sales, with the previous month's sales.