Unlock a world of possibilities! Login now and discover the exclusive benefits awaiting you.
- Qlik Community
- :
- All Forums
- :
- QlikView App Dev
- :
- how to construct chart
- Subscribe to RSS Feed
- Mark Topic as New
- Mark Topic as Read
- Float this Topic for Current User
- Bookmark
- Subscribe
- Mute
- Printer Friendly Page
- Mark as New
- Bookmark
- Subscribe
- Mute
- Subscribe to RSS Feed
- Permalink
- Report Inappropriate Content
how to construct chart
Dear Team,
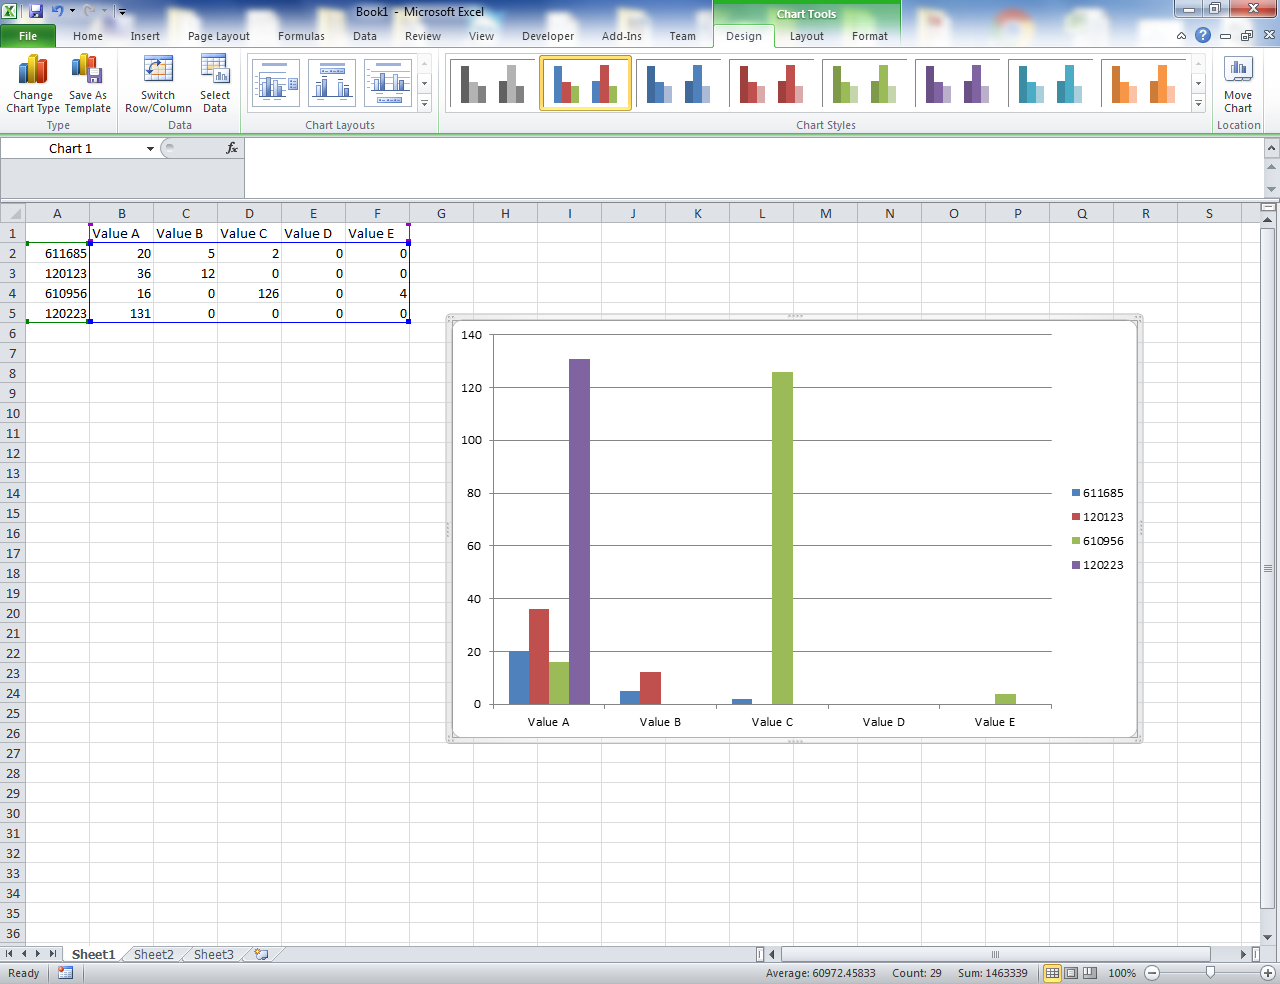
I have similar data as shown below. and i manage to create a chart in excel correctly. But in qlikview, what should i put under dimension and expression? i dont seem able to make it works in qlikview
- « Previous Replies
-
- 1
- 2
- Next Replies »
- Mark as New
- Bookmark
- Subscribe
- Mute
- Subscribe to RSS Feed
- Permalink
- Report Inappropriate Content
- Mark as New
- Bookmark
- Subscribe
- Mute
- Subscribe to RSS Feed
- Permalink
- Report Inappropriate Content
Hi Chee,
I want to know about your data source if you got it from excel . Then name 1 st column in excel as ID or relevant to data.
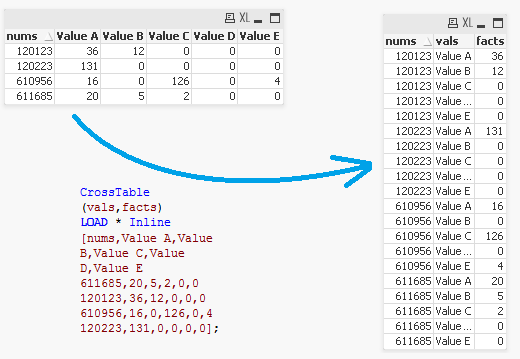
After that convert it into cross table and use as like you.
Thanks,
Arvind Patil
- Mark as New
- Bookmark
- Subscribe
- Mute
- Subscribe to RSS Feed
- Permalink
- Report Inappropriate Content
must i convert to crosstable like what you shown?
My data structure is same like what shown in my screenshot in excel
- Mark as New
- Bookmark
- Subscribe
- Mute
- Subscribe to RSS Feed
- Permalink
- Report Inappropriate Content
My data structure is same like what shown in my screenshot in excel
- Mark as New
- Bookmark
- Subscribe
- Mute
- Subscribe to RSS Feed
- Permalink
- Report Inappropriate Content
HI Chee,
I hope it will serve your purpose.
Please find the attachment.
Thanks,
Arvind Patil
- Mark as New
- Bookmark
- Subscribe
- Mute
- Subscribe to RSS Feed
- Permalink
- Report Inappropriate Content
In More Corrective way is:
Thanks,
Arvind Patil
- Mark as New
- Bookmark
- Subscribe
- Mute
- Subscribe to RSS Feed
- Permalink
- Report Inappropriate Content
You Need add below line before your load statement of data.
Crosstable(Dimension,Value,1)
Load
ID,
ValueA,
ValueB,
ValueC,
ValueD,
ValueE
Source Data;
then you can use Dim and ID as dimension and sum(Value) as Expression.
Thanks
- Mark as New
- Bookmark
- Subscribe
- Mute
- Subscribe to RSS Feed
- Permalink
- Report Inappropriate Content
Just follow this steps:
Step 1. Modify your script with CrossTable() function
Step 2. Create a Bar Chart with two dimensions "vals" and "nums". Create an expression "sum(facts)"
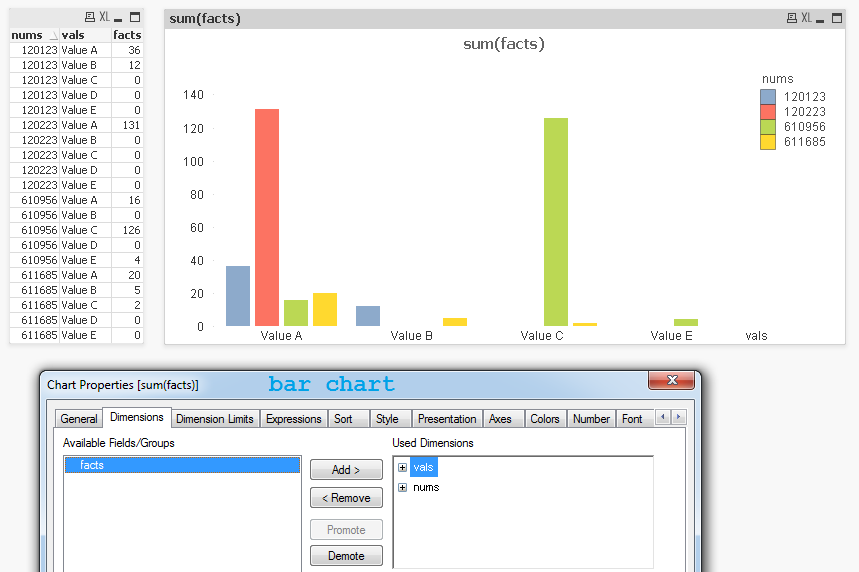
And now we have the same picture as at your screenshot.
- Mark as New
- Bookmark
- Subscribe
- Mute
- Subscribe to RSS Feed
- Permalink
- Report Inappropriate Content
Attachement for description above.
- « Previous Replies
-
- 1
- 2
- Next Replies »