Unlock a world of possibilities! Login now and discover the exclusive benefits awaiting you.
Announcements
Qlik Open Lakehouse is Now Generally Available! Discover the key highlights and partner resources here.
- Qlik Community
- :
- All Forums
- :
- QlikView App Dev
- :
- how to create Grouped bar chart grouped by the n...
Options
- Subscribe to RSS Feed
- Mark Topic as New
- Mark Topic as Read
- Float this Topic for Current User
- Bookmark
- Subscribe
- Mute
- Printer Friendly Page
Turn on suggestions
Auto-suggest helps you quickly narrow down your search results by suggesting possible matches as you type.
Showing results for
Anonymous
Not applicable
2016-12-14
07:16 AM
- Mark as New
- Bookmark
- Subscribe
- Mute
- Subscribe to RSS Feed
- Permalink
- Report Inappropriate Content
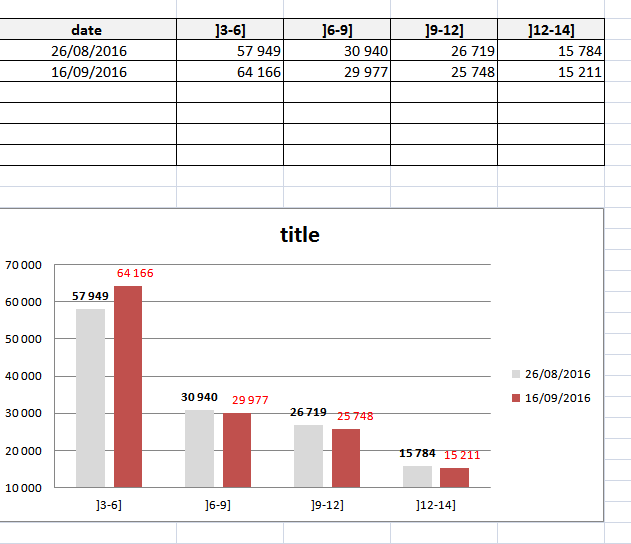
how to create Grouped bar chart grouped by the names of measures
hello,
I want to create a bar chart like this below, based on this table, would any one help !
thank you
543 Views
1 Solution
Accepted Solutions
MVP
2016-12-14
11:49 AM
- Mark as New
- Bookmark
- Subscribe
- Mute
- Subscribe to RSS Feed
- Permalink
- Report Inappropriate Content
May be use The Crosstable Load to transform your table and then use the new column as dimension and date as second dimension
492 Views
1 Reply
MVP
2016-12-14
11:49 AM
- Mark as New
- Bookmark
- Subscribe
- Mute
- Subscribe to RSS Feed
- Permalink
- Report Inappropriate Content
May be use The Crosstable Load to transform your table and then use the new column as dimension and date as second dimension
493 Views