Unlock a world of possibilities! Login now and discover the exclusive benefits awaiting you.
- Qlik Community
- :
- All Forums
- :
- QlikView App Dev
- :
- how to create a percentage line
- Subscribe to RSS Feed
- Mark Topic as New
- Mark Topic as Read
- Float this Topic for Current User
- Bookmark
- Subscribe
- Mute
- Printer Friendly Page
- Mark as New
- Bookmark
- Subscribe
- Mute
- Subscribe to RSS Feed
- Permalink
- Report Inappropriate Content
how to create a percentage line
Hi,
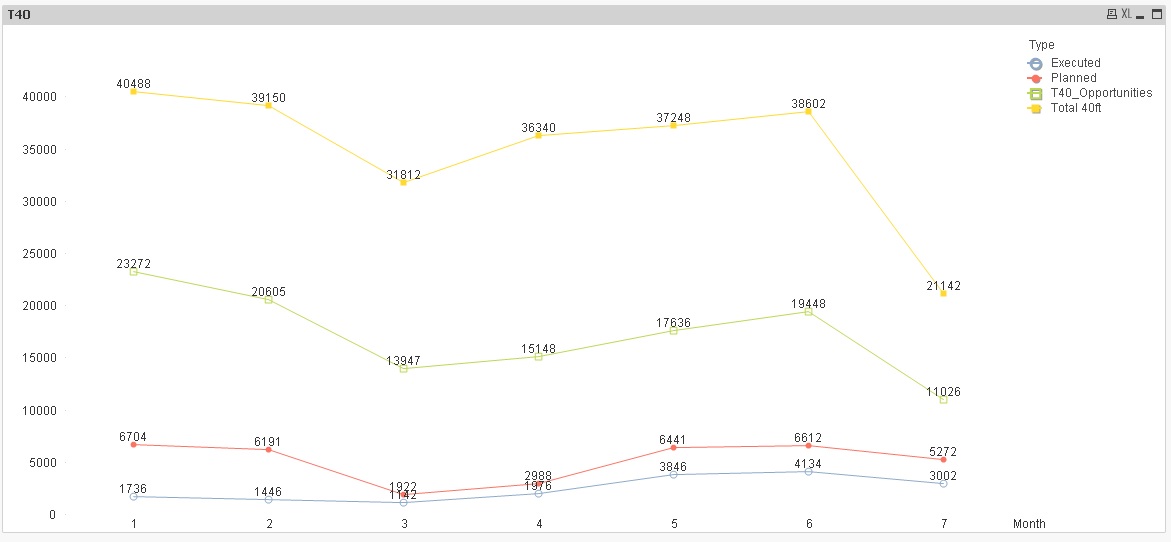
I have the following chart.
I need to create another line that represents 'Planned' as a percentage over 'total 40f'.
Please assist.
thank you so much
grace
- Mark as New
- Bookmark
- Subscribe
- Mute
- Subscribe to RSS Feed
- Permalink
- Report Inappropriate Content
Are you using 2 dimensions and 1 expression or 1 dimension and 4 expressions?
- Mark as New
- Bookmark
- Subscribe
- Mute
- Subscribe to RSS Feed
- Permalink
- Report Inappropriate Content
Hi. I'm using 2 dimensions and 1 expression.
- Mark as New
- Bookmark
- Subscribe
- Mute
- Subscribe to RSS Feed
- Permalink
- Report Inappropriate Content
Would changing to 1 dimension and 4 expression (actually 5 when we add the fifth line) something which would work? if not, then would you be able to provide a sample?
- Mark as New
- Bookmark
- Subscribe
- Mute
- Subscribe to RSS Feed
- Permalink
- Report Inappropriate Content
Hi,
I am not sure how to change it to 4 expressions. The only expression that I have now is ‘Boxes’.
The data that I have is very raw.
The 1-7 being the months and the figures are ‘boxes’
Thanks
Type
1
2
3
4
5
6
7
Total 40ft
40,488
39,150
31,812
36,340
37,248
38,602
21,142
T40_Opportunities
23272
20605
13947
15148
17636
19448
11026
Planned
6,704
6,191
1,922
2,988
6,441
6,612
5,272
Executed
1,736
1,446
1,142
1,976
3,846
4,134
3,002