Unlock a world of possibilities! Login now and discover the exclusive benefits awaiting you.
- Qlik Community
- :
- All Forums
- :
- QlikView App Dev
- :
- how to create a pie chart with "White Outline" or ...
- Subscribe to RSS Feed
- Mark Topic as New
- Mark Topic as Read
- Float this Topic for Current User
- Bookmark
- Subscribe
- Mute
- Printer Friendly Page
- Mark as New
- Bookmark
- Subscribe
- Mute
- Subscribe to RSS Feed
- Permalink
- Report Inappropriate Content
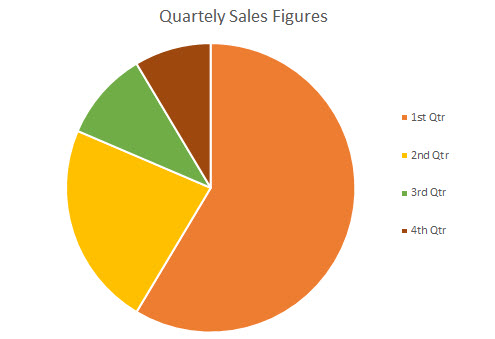
how to create a pie chart with "White Outline" or space in between of teh segment
Hi guys,
I want to create a pie chart like the image. But i dont know how 
hwo to create
- white outline?
- or give a space in between of the segments?
Rgds
Jim
Accepted Solutions
- Mark as New
- Bookmark
- Subscribe
- Mute
- Subscribe to RSS Feed
- Permalink
- Report Inappropriate Content
- Mark as New
- Bookmark
- Subscribe
- Mute
- Subscribe to RSS Feed
- Permalink
- Report Inappropriate Content
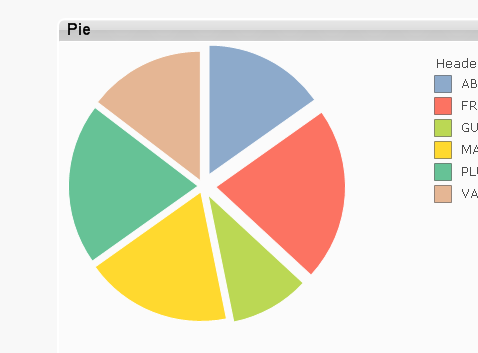
One way is to set up Pie Pop-out to 1
or sum/count(yourfield).
go to your Expression ,press the '+' sign next to it and choose an option from the dropdown.
Feeling Qlikngry?
- Mark as New
- Bookmark
- Subscribe
- Mute
- Subscribe to RSS Feed
- Permalink
- Report Inappropriate Content
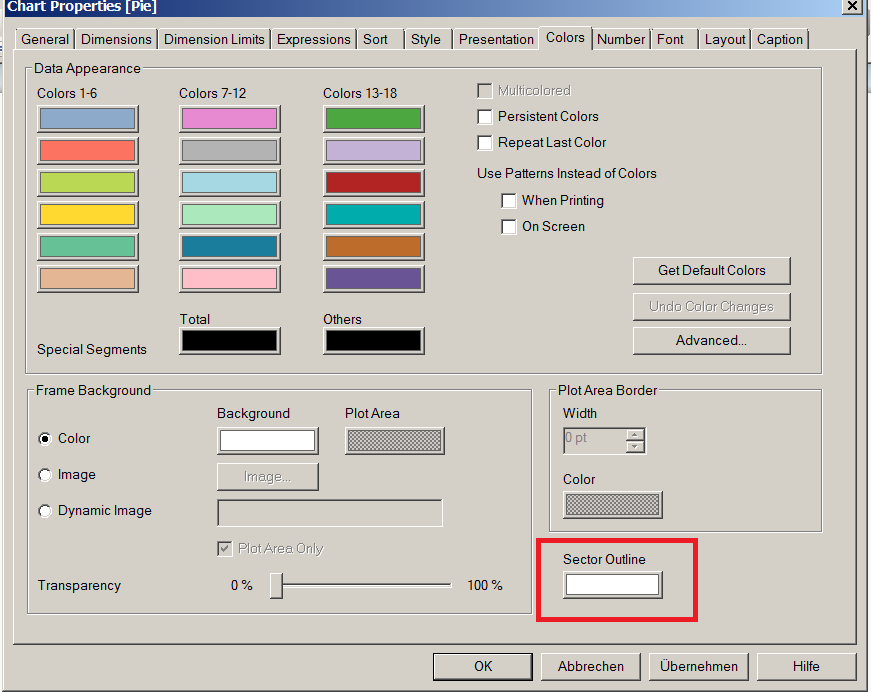
have a look at this option:
- Mark as New
- Bookmark
- Subscribe
- Mute
- Subscribe to RSS Feed
- Permalink
- Report Inappropriate Content
Did this work for you?
- Mark as New
- Bookmark
- Subscribe
- Mute
- Subscribe to RSS Feed
- Permalink
- Report Inappropriate Content
Hi Frank,
the sector outline managed to change to WHITE. But do you know where to set the tickness of the outline??? just like the screenshot i posted?
Rgds
Jim
- Mark as New
- Bookmark
- Subscribe
- Mute
- Subscribe to RSS Feed
- Permalink
- Report Inappropriate Content
I guess the only way to do this is like robert_mika
has mentioned to play with the Pi Popout setting.
But its not looking very nice
- Mark as New
- Bookmark
- Subscribe
- Mute
- Subscribe to RSS Feed
- Permalink
- Report Inappropriate Content
HI Frank,
is ok. I think Mika's solution is what i am loooking for.
I have another issue - mind to have a look on this post? How to create LOW MEDIUM HIGH bar chart with Y-axis 0-100% & number value in the data points
- Mark as New
- Bookmark
- Subscribe
- Mute
- Subscribe to RSS Feed
- Permalink
- Report Inappropriate Content
OK,
then mark robert_mikas answer as the correct answer to close this thread!