Unlock a world of possibilities! Login now and discover the exclusive benefits awaiting you.
- Qlik Community
- :
- All Forums
- :
- QlikView App Dev
- :
- how to get Distinct Count CustomerID in a rolling ...
- Subscribe to RSS Feed
- Mark Topic as New
- Mark Topic as Read
- Float this Topic for Current User
- Bookmark
- Subscribe
- Mute
- Printer Friendly Page
- Mark as New
- Bookmark
- Subscribe
- Mute
- Subscribe to RSS Feed
- Permalink
- Report Inappropriate Content
how to get Distinct Count CustomerID in a rolling 12 months window
Hi, I am fairly new to QV.
Searched up in the community, but didn't find something similar to my question.Can anyone help with the script in QV Script, not Expression. Thanks!
the input is
| Person_ID | post_period | |||||||
| 1/31/2014 | ||||||||
| 33993 | 2/28/2014 | |||||||
| 33993 | 3/31/2014 | |||||||
| 33993 | 4/30/2014 | |||||||
| 5/31/2014 | ||||||||
| 33993 | 6/30/2014 | |||||||
| 7/31/2014 | ||||||||
| 33993 | 8/31/2014 | |||||||
| ||||||||
| 231493 | 1/31/2015 | |||||||
| 231595 | 1/31/2015 | |||||||
| 231678 | 1/31/2015 | |||||||
| 231784 | 1/31/2015 | |||||||
| 231493 | 2/28/2015 | |||||||
| 231636 | 2/28/2015 | |||||||
| 231998 | 2/28/2015 |
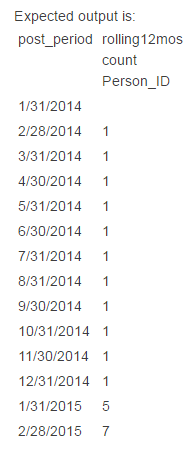
Expected output is:
| post_period | rolling12mos count Person_ID |
| 1/31/2014 | |
| 2/28/2014 | 1 |
| 3/31/2014 | 1 |
| 4/30/2014 | 1 |
| 5/31/2014 | 1 |
| 6/30/2014 | 1 |
| 7/31/2014 | 1 |
| 8/31/2014 | 1 |
| 9/30/2014 | 1 |
| 10/31/2014 | 1 |
| 11/30/2014 | 1 |
| 12/31/2014 | 1 |
| 1/31/2015 | 5 |
| 2/28/2015 | 7 |
Thanks!
- « Previous Replies
-
- 1
- 2
- Next Replies »
Accepted Solutions
- Mark as New
- Bookmark
- Subscribe
- Mute
- Subscribe to RSS Feed
- Permalink
- Report Inappropriate Content
May be using a link table:
Table:
LOAD * INLINE [
Person_ID, post_period
, 1/31/2014
33993, 2/28/2014
33993, 3/31/2014
33993, 4/30/2014
, 5/31/2014
33993, 6/30/2014
, 7/31/2014
33993, 8/31/2014
, 9/30/2014
, 10/31/2014
, 11/30/2014
, 12/31/2014
231493, 1/31/2015
231595, 1/31/2015
231678, 1/31/2015
231784, 1/31/2015
231493, 2/28/2015
231636, 2/28/2015
231998, 2/28/2015
];
LinkTable:
LOAD Person_ID,
Date(Floor(MonthEnd(AddMonths(MonthStart(Min), IterNo()-1)))) as Date
While Floor(MonthEnd(AddMonths(MonthStart(Min), IterNo()-1))) <= Max;
LOAD Person_ID,
Min(post_period) as Min,
Floor(MonthEnd(Today())) as Max
Resident Table
Where Len(Trim(Person_ID)) > 0
Group By Person_ID;
- Mark as New
- Bookmark
- Subscribe
- Mute
- Subscribe to RSS Feed
- Permalink
- Report Inappropriate Content
Well, I wouldn't calculate this entirely in the script, but it can be done like this:
Data:
LOAD Person_ID, date#(post_period,'M/DD/YYYY') as post_period INLINE [
Person_ID, post_period
,1/31/2014
33993, 2/28/2014
33993, 3/31/2014
33993, 4/30/2014
,5/31/2014
33993, 6/30/2014
,7/31/2014
33993, 8/31/2014
,9/30/2014,
,10/31/2014,
,11/30/2014,
,12/31/2014
231493, 1/31/2015
231595, 1/31/2015
231678, 1/31/2015
231784, 1/31/2015
231493, 2/28/2015
231636, 2/28/2015
231998, 2/28/2015
];
RIGHT JOIN (Data) // I'd skip this join
// And create an AsOf table like below
LOAD DISTINCT
post_period as asof_period,
Date(Floor(MonthEnd(post_period,1-IterNo())),'M/DD/YYYY') as post_period
RESIDENT
Data
While IterNo() <=12
;
// And not create this Result table, but use the count expression in a chart with asof_period as dimension
Result:
LOAD
asof_period as period,
count(distinct Person_ID) as count
RESIDENT
Data
GROUP BY asof_period
;
talk is cheap, supply exceeds demand
- Mark as New
- Bookmark
- Subscribe
- Mute
- Subscribe to RSS Feed
- Permalink
- Report Inappropriate Content
monthasof:
noconcatenate load distict
date,
year(date)*12 + num(month(date) as ymnum
resident yourtable where isnull (date) = 0;
outer join (monthasof)
load distict
date as dateasof
ymnum as ymnumasof
resident monthasof;
newmonthasof:
noconcatenate load distict *,
if(ymnum - ymnumasof < 12 and ymnum - ymnumasof >= 0, 1) as rollingtwelve;
drop table monthasof;
..... Make sure newdateasof table links to yourtable on date field .....
in the GUI ...
new chart object
dateasof as the dimension
expression ....
count (distinct {< rollingtwelve = {'1'} >} customersid)
That's all from me search John Witherspoon time analysis, rolling dates, monthasof
- Mark as New
- Bookmark
- Subscribe
- Mute
- Subscribe to RSS Feed
- Permalink
- Report Inappropriate Content
Thanks Sunny. The script apparently is for rolling distinct count, but not rolling 12-month distinct count? Still struggling with 12-month window issue. Can you help? Thanks again!
- Mark as New
- Bookmark
- Subscribe
- Mute
- Subscribe to RSS Feed
- Permalink
- Report Inappropriate Content
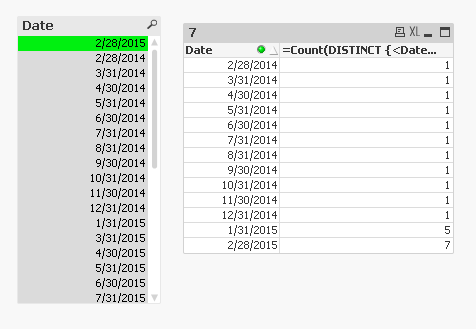
You can use set analysis for restricting for 12 months like I have done in the example file above? When 2/28/2015 is selected, we see 12 months worth of data. Isn't that what you want?
- Mark as New
- Bookmark
- Subscribe
- Mute
- Subscribe to RSS Feed
- Permalink
- Report Inappropriate Content
Sorry for the ambiguity. I use Qlik Script to clean the data, but the data is visualized in Tableau.
What I need is the data that for every month is the past years, showing the prior 12-month distinct customer count.
For example, for post period 2/28/2015, a column shows distinct count from Mar2014-Feb 2015. for post period 6/30/2016 , the column show distinct count from july 2015-2016. the visualization part is done in Tableau.
Thanks
- Mark as New
- Bookmark
- Subscribe
- Mute
- Subscribe to RSS Feed
- Permalink
- Report Inappropriate Content
So is this now what you want?
Would you be able to show (just like above), what is that you want 
- Mark as New
- Bookmark
- Subscribe
- Mute
- Subscribe to RSS Feed
- Permalink
- Report Inappropriate Content
Yes,that is what I want. I used your script, the distinct count is not dropping the records out of 12-month window. and sadly, I don't know how to fix it.
- Mark as New
- Bookmark
- Subscribe
- Mute
- Subscribe to RSS Feed
- Permalink
- Report Inappropriate Content
So you want a script based solution which saves this result in a csv file?
- « Previous Replies
-
- 1
- 2
- Next Replies »