Unlock a world of possibilities! Login now and discover the exclusive benefits awaiting you.
- Qlik Community
- :
- All Forums
- :
- QlikView App Dev
- :
- how to get bar chart to display all Dimension valu...
- Subscribe to RSS Feed
- Mark Topic as New
- Mark Topic as Read
- Float this Topic for Current User
- Bookmark
- Subscribe
- Mute
- Printer Friendly Page
- Mark as New
- Bookmark
- Subscribe
- Mute
- Subscribe to RSS Feed
- Permalink
- Report Inappropriate Content
how to get bar chart to display all Dimension values
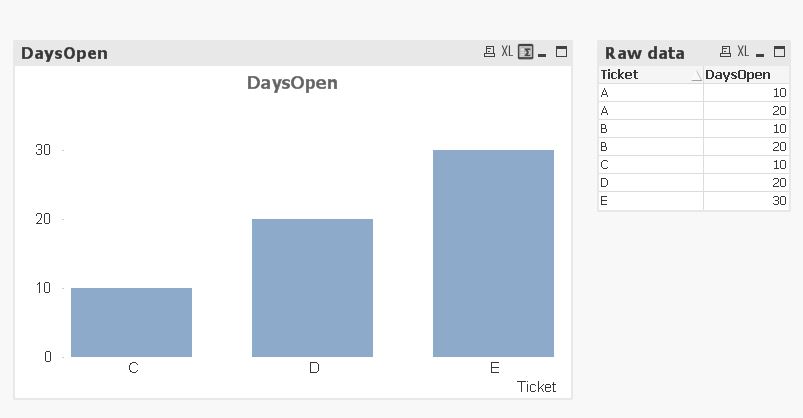
I need to display all values as visible in the raw data. 'A' / 'B' values are missing from bar chart.
I cannot have the expression sum up the values, just a simply display in bar chart format.
- « Previous Replies
-
- 1
- 2
- Next Replies »
Accepted Solutions
- Mark as New
- Bookmark
- Subscribe
- Mute
- Subscribe to RSS Feed
- Permalink
- Report Inappropriate Content
May be like this?
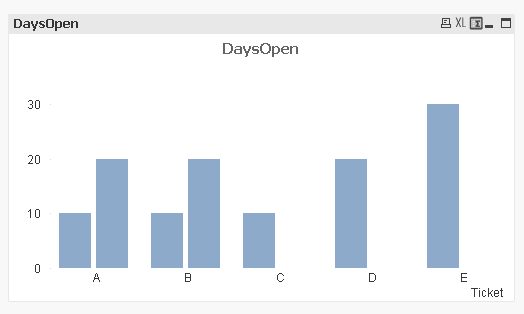
Script Changes:
LOAD *,
If(Previous(Ticket) = Ticket, RangeSum(Peek('Key'), 1), 1) as Key;
load * Inline [
Ticket, DaysOpen, cnt
A, 10, 1
A, 20, 2
B, 10, 3
B, 20, 4
C, 10, 5
D, 20, 6
E, 30, 7
];
Chart Changes:
Added Key as second dimension
- Mark as New
- Bookmark
- Subscribe
- Mute
- Subscribe to RSS Feed
- Permalink
- Report Inappropriate Content

- Mark as New
- Bookmark
- Subscribe
- Mute
- Subscribe to RSS Feed
- Permalink
- Report Inappropriate Content
I would like to see the 2 two individual values for 'A' as 2 bar lines, not summed up ...
- Mark as New
- Bookmark
- Subscribe
- Mute
- Subscribe to RSS Feed
- Permalink
- Report Inappropriate Content
What are you looking for? Sum, Avg? You should Just the field name itself won't work here
- Mark as New
- Bookmark
- Subscribe
- Mute
- Subscribe to RSS Feed
- Permalink
- Report Inappropriate Content
May be like this?
Script Changes:
LOAD *,
If(Previous(Ticket) = Ticket, RangeSum(Peek('Key'), 1), 1) as Key;
load * Inline [
Ticket, DaysOpen, cnt
A, 10, 1
A, 20, 2
B, 10, 3
B, 20, 4
C, 10, 5
D, 20, 6
E, 30, 7
];
Chart Changes:
Added Key as second dimension
- Mark as New
- Bookmark
- Subscribe
- Mute
- Subscribe to RSS Feed
- Permalink
- Report Inappropriate Content
not sum or average, just a dump of the data into the bar chart by daysopen.
- Mark as New
- Bookmark
- Subscribe
- Mute
- Subscribe to RSS Feed
- Permalink
- Report Inappropriate Content
- Mark as New
- Bookmark
- Subscribe
- Mute
- Subscribe to RSS Feed
- Permalink
- Report Inappropriate Content
Hi ,
Hope this is what you required,

In Style -> Keep Sub Type -> Grouped Checked
or
Else another Chart
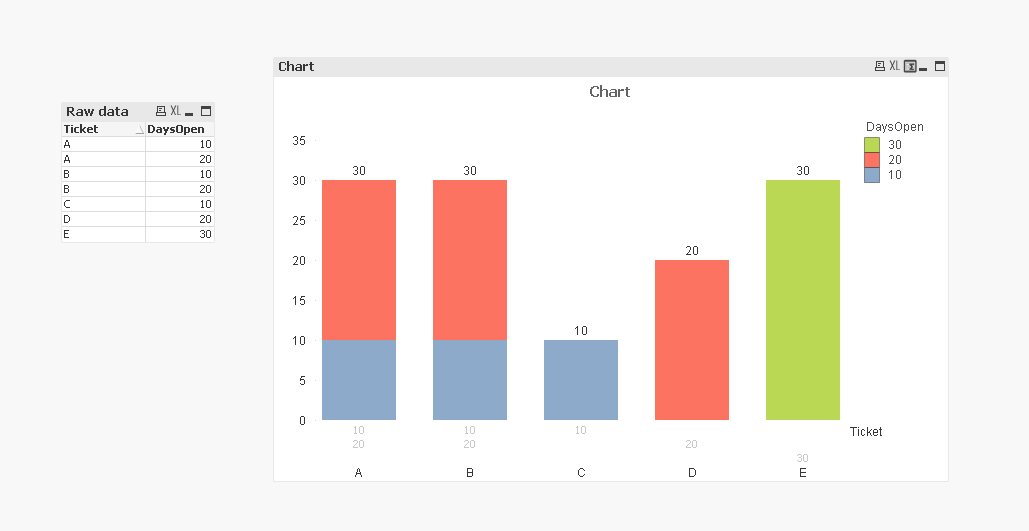
Dimension:
Ticket
DaysOpen
Expression:
DaysOpen
Hope this Helps,
Regards,
HirisH
- Mark as New
- Bookmark
- Subscribe
- Mute
- Subscribe to RSS Feed
- Permalink
- Report Inappropriate Content
Little easier ! PFA
- Mark as New
- Bookmark
- Subscribe
- Mute
- Subscribe to RSS Feed
- Permalink
- Report Inappropriate Content
nice ! I like it ....
- « Previous Replies
-
- 1
- 2
- Next Replies »