Unlock a world of possibilities! Login now and discover the exclusive benefits awaiting you.
- Qlik Community
- :
- All Forums
- :
- QlikView App Dev
- :
- how to place dimensions in y axis in a charts( bar...
- Subscribe to RSS Feed
- Mark Topic as New
- Mark Topic as Read
- Float this Topic for Current User
- Bookmark
- Subscribe
- Mute
- Printer Friendly Page
- Mark as New
- Bookmark
- Subscribe
- Mute
- Subscribe to RSS Feed
- Permalink
- Report Inappropriate Content
how to place dimensions in y axis in a charts( bar chart,line chart)
Hi team Members ,
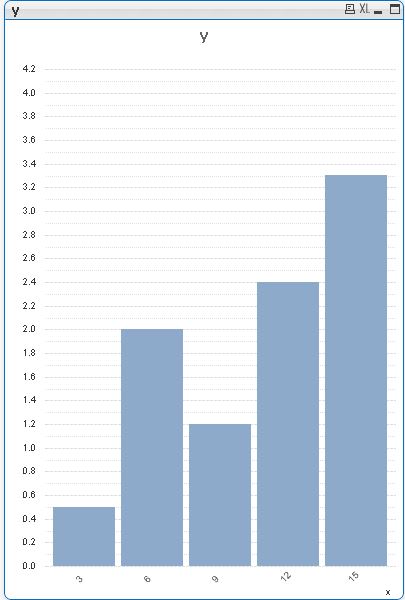
I have 2 dimensions x,y
| x | y |
| 3 | 0.5 |
| 6 | 2 |
| 9 | 1.2 |
| 12 | 2.4 |
| 15 | 3.3 |
Now i created bar chart for this data in which i got X values created in the table on x axis but i was unable to get values of Y on y axis plz help me out that how i can get the values on y axis( the same values i had n my dimension )
In advance thanks for your help
- Tags:
- new_to_qlikview
- « Previous Replies
-
- 1
- 2
- Next Replies »
- Mark as New
- Bookmark
- Subscribe
- Mute
- Subscribe to RSS Feed
- Permalink
- Report Inappropriate Content
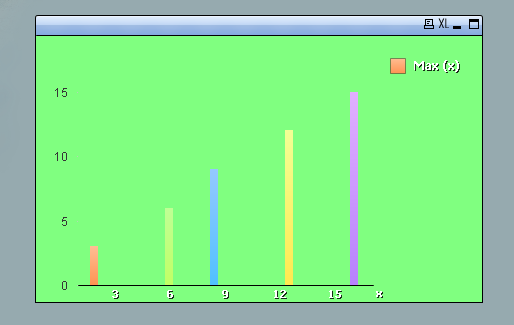
if you truly want your Y values on the Y axis, make your dimension X and then your expression Only(Y) or Max(Y), assuming they are related?
- Mark as New
- Bookmark
- Subscribe
- Mute
- Subscribe to RSS Feed
- Permalink
- Report Inappropriate Content
like this?
- Mark as New
- Bookmark
- Subscribe
- Mute
- Subscribe to RSS Feed
- Permalink
- Report Inappropriate Content
hi team,
I hope u are misunderstanding or may be i m not able to put the exact thing i need
on y axis scale i need to see my y dimension values(
| 0.5 |
| 2 |
| 1.2 |
| 2.4 |
| 3.3 |
) i need to see only these 5 values on my y axis scale in a chart .
- Mark as New
- Bookmark
- Subscribe
- Mute
- Subscribe to RSS Feed
- Permalink
- Report Inappropriate Content
How you created x-axis sum(x)
in same use one more expression sum(Y)
and then go to axis tab which you change sum(Y) as right (Top ) ie position.
- Mark as New
- Bookmark
- Subscribe
- Mute
- Subscribe to RSS Feed
- Permalink
- Report Inappropriate Content
Hi Nitesh,
Please go to the properties of the chart and then go to the 'Expressions' tab and click on 'Text on Axis'.
Have a try and let me know whether this is the result you wanted?
- Mark as New
- Bookmark
- Subscribe
- Mute
- Subscribe to RSS Feed
- Permalink
- Report Inappropriate Content
check this
- Mark as New
- Bookmark
- Subscribe
- Mute
- Subscribe to RSS Feed
- Permalink
- Report Inappropriate Content
Thanks for you help but i think either u guys u not understanding my question or may be i m not able to put the exact question
- Mark as New
- Bookmark
- Subscribe
- Mute
- Subscribe to RSS Feed
- Permalink
- Report Inappropriate Content
Hi,
Are you referring to something like the bar chart or you can get the exact values on a scatter chart?
- Mark as New
- Bookmark
- Subscribe
- Mute
- Subscribe to RSS Feed
- Permalink
- Report Inappropriate Content
Hi Nitesh,
Use calculated Dimension in chart
=Only(Y)
and expression
=Sum(X)
Regards,
Kiran
- « Previous Replies
-
- 1
- 2
- Next Replies »