Unlock a world of possibilities! Login now and discover the exclusive benefits awaiting you.
- Qlik Community
- :
- All Forums
- :
- QlikView App Dev
- :
- how to place dimensions in y axis in a charts( bar...
- Subscribe to RSS Feed
- Mark Topic as New
- Mark Topic as Read
- Float this Topic for Current User
- Bookmark
- Subscribe
- Mute
- Printer Friendly Page
- Mark as New
- Bookmark
- Subscribe
- Mute
- Subscribe to RSS Feed
- Permalink
- Report Inappropriate Content
how to place dimensions in y axis in a charts( bar chart,line chart)
Hi team Members ,
I have 2 dimensions x,y
| x | y |
| 3 | 0.5 |
| 6 | 2 |
| 9 | 1.2 |
| 12 | 2.4 |
| 15 | 3.3 |
Now i created bar chart for this data in which i got X values created in the table on x axis but i was unable to get values of Y on y axis plz help me out that how i can get the values on y axis( the same values i had n my dimension )
In advance thanks for your help
- Tags:
- new_to_qlikview
- Mark as New
- Bookmark
- Subscribe
- Mute
- Subscribe to RSS Feed
- Permalink
- Report Inappropriate Content
Hey,
as far i know there is no way of getting second dimension value on y-axis. On y - axis only expression values are shown.
You can do one think make expression to show Y values . In that case Y values will be shown on Y-axis
- Mark as New
- Bookmark
- Subscribe
- Mute
- Subscribe to RSS Feed
- Permalink
- Report Inappropriate Content
Hi Nitesh
Actually, what you can do is, you currently sitting with two dimensions, x and y. the only way I can think of to express both of them in a chart is to treat them as an equation y = x, what this mean is, one variable wil be your dimension and the other will be your measure, u just put it as it is in the expression tab.
Qlikview will automatically create a relationship (y=x) which will accurately measure how y is related to x. I have created a qlikview app, but I don't know how to load it, im sorry.
Hope this answers your question.
Best regards
Dlamini
- Mark as New
- Bookmark
- Subscribe
- Mute
- Subscribe to RSS Feed
- Permalink
- Report Inappropriate Content
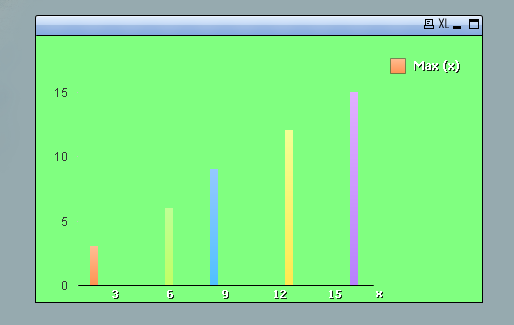
Hi Nitesh,
Qlikview will considers expression on X-axis and Dimension on Y-Axis vice-verse..
Please check the below snapshot.It may reaches your requirement.
- Mark as New
- Bookmark
- Subscribe
- Mute
- Subscribe to RSS Feed
- Permalink
- Report Inappropriate Content
Hi Krishna
Thanks for your opinion but i had tried it earlier but its not working.