Unlock a world of possibilities! Login now and discover the exclusive benefits awaiting you.
- Qlik Community
- :
- All Forums
- :
- QlikView App Dev
- :
- how to set color condition in bar chart
- Subscribe to RSS Feed
- Mark Topic as New
- Mark Topic as Read
- Float this Topic for Current User
- Bookmark
- Subscribe
- Mute
- Printer Friendly Page
- Mark as New
- Bookmark
- Subscribe
- Mute
- Subscribe to RSS Feed
- Permalink
- Report Inappropriate Content
how to set color condition in bar chart
i want to show condition in bar chart like if avergae is 100% dn it should be green otherwise if between 95 to 100 5 dn orange below that red.
- « Previous Replies
-
- 1
- 2
- Next Replies »
- Mark as New
- Bookmark
- Subscribe
- Mute
- Subscribe to RSS Feed
- Permalink
- Report Inappropriate Content
Hi,
Go to Expression,
Cleck + next to the expression.
Here Background Color
Add expression as
if(Column(1) > 0.95 and column(1) < 1, orange(),red());
Regards,
Kaushik Solanki
- Mark as New
- Bookmark
- Subscribe
- Mute
- Subscribe to RSS Feed
- Permalink
- Report Inappropriate Content
its not working
- Mark as New
- Bookmark
- Subscribe
- Mute
- Subscribe to RSS Feed
- Permalink
- Report Inappropriate Content
Kindly post your Application.
Regards,
Kaushik Solanki
- Mark as New
- Bookmark
- Subscribe
- Mute
- Subscribe to RSS Feed
- Permalink
- Report Inappropriate Content
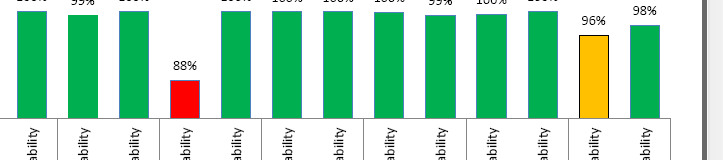
i want to show something like dis
- Mark as New
- Bookmark
- Subscribe
- Mute
- Subscribe to RSS Feed
- Permalink
- Report Inappropriate Content
Have a look at the attached application.
Regards,
Kaushik Solanki
- Mark as New
- Bookmark
- Subscribe
- Mute
- Subscribe to RSS Feed
- Permalink
- Report Inappropriate Content
is your expression like avg(SalesAmount) or something like that. Please share more detail on the application
- Mark as New
- Bookmark
- Subscribe
- Mute
- Subscribe to RSS Feed
- Permalink
- Report Inappropriate Content
i have multiple excel and i have combined them and showed dm in a single graph and have used 8 expression in this and my exp are like totaltime /breakdowntime to show the availablity of the system so i want if if system is available less then 98% then it should be orange less dn 95% dn red otherwise green
- Mark as New
- Bookmark
- Subscribe
- Mute
- Subscribe to RSS Feed
- Permalink
- Report Inappropriate Content
you have 8 expression in a BAR chart and as per your dimension values those 8 will be repeated for each dimension values.
If your avg calculation is done by totaltime /breakdowntime
then as Kaushik mentioned you need to go to each expression background and
add the logic as
if( totaltime /breakdowntime>0 and totaltime /breakdowntime <.95,red(),
if( totaltime /breakdowntime >=.95 and totaltime /breakdowntime <.98,orange [use the RGB for Orange],green()))
- Mark as New
- Bookmark
- Subscribe
- Mute
- Subscribe to RSS Feed
- Permalink
- Report Inappropriate Content
Hi kaushik,
Where u wrote that if condition i didn't find any where in application can u please help me
What is the Cleck + next to the expression.?
Thanks
- « Previous Replies
-
- 1
- 2
- Next Replies »