Unlock a world of possibilities! Login now and discover the exclusive benefits awaiting you.
- Qlik Community
- :
- All Forums
- :
- QlikView App Dev
- :
- how to show 0% and 100% values for line chart in Q...
Options
- Subscribe to RSS Feed
- Mark Topic as New
- Mark Topic as Read
- Float this Topic for Current User
- Bookmark
- Subscribe
- Mute
- Printer Friendly Page
Turn on suggestions
Auto-suggest helps you quickly narrow down your search results by suggesting possible matches as you type.
Showing results for
Creator III
2018-10-08
10:51 AM
- Mark as New
- Bookmark
- Subscribe
- Mute
- Subscribe to RSS Feed
- Permalink
- Report Inappropriate Content
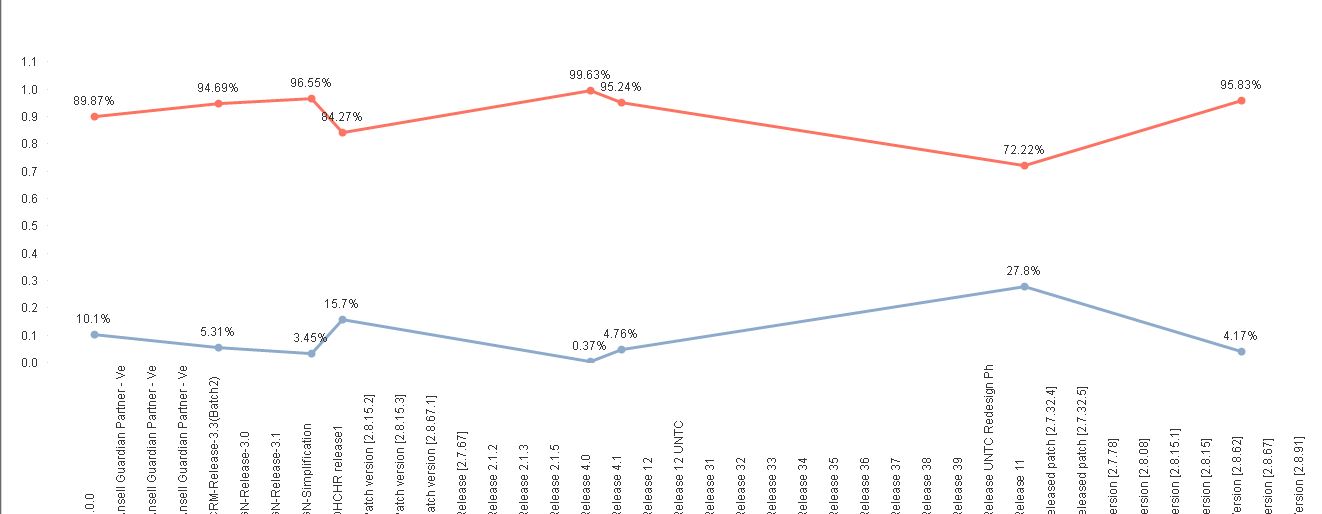
how to show 0% and 100% values for line chart in Qlikview
Hi Experts,
I have created line chart with following expressions
1. =num((Sum([Total release wise UAT Defects])/Sum([DefectList.No.of Iterations]))*100,'#,##')&'%'
2. =num((Sum([DefectList.No.of Iterations])-Sum([Total release wise UAT Defects]))/num(Sum([DefectList.No.of Iterations]),'###0')*100,'##,##')&'%'
it is giving output correctly. but it's not showing 0%'s and 100%'s Values in my line chart. how to show them also
This is what i created chart
3,024 Views
- « Previous Replies
-
- 1
- 2
- Next Replies »
10 Replies
Creator III
2018-10-09
09:40 AM
Author
- Mark as New
- Bookmark
- Subscribe
- Mute
- Subscribe to RSS Feed
- Permalink
- Report Inappropriate Content
Hi Frank,
Now, Again i have checked it is working thank you so much for your solution
And you have any idea about this please check once
237 Views
- « Previous Replies
-
- 1
- 2
- Next Replies »