Unlock a world of possibilities! Login now and discover the exclusive benefits awaiting you.
- Qlik Community
- :
- All Forums
- :
- QlikView App Dev
- :
- how to write an expression for date range using va...
- Subscribe to RSS Feed
- Mark Topic as New
- Mark Topic as Read
- Float this Topic for Current User
- Bookmark
- Subscribe
- Mute
- Printer Friendly Page
- Mark as New
- Bookmark
- Subscribe
- Mute
- Subscribe to RSS Feed
- Permalink
- Report Inappropriate Content
how to write an expression for date range using variable
Hi,
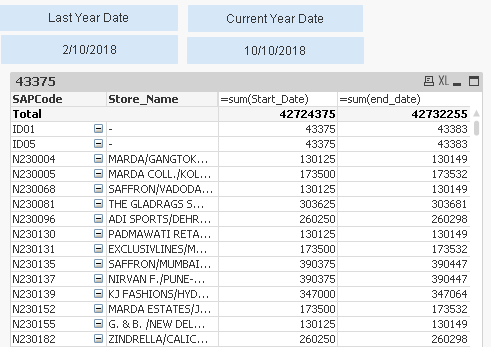
I want to write an expression using variables start_date and end_date as shown in image
I want to show sales between the start_date and end_date. Both start_date and end_date are variables and these are text boxes
Now want to call both the variables in chart by writing expression using set analysis, Please help me in writing the same.
please help stalwar1
- « Previous Replies
-
- 1
- 2
- Next Replies »
- Mark as New
- Bookmark
- Subscribe
- Mute
- Subscribe to RSS Feed
- Permalink
- Report Inappropriate Content
Hi
qvw attachement
- Mark as New
- Bookmark
- Subscribe
- Mute
- Subscribe to RSS Feed
- Permalink
- Report Inappropriate Content
Please help stalwar1, rubenmarin loveisfail
- Mark as New
- Bookmark
- Subscribe
- Mute
- Subscribe to RSS Feed
- Permalink
- Report Inappropriate Content
Sure - Can you tell us Which sheet we need to look and explain little more, Which filters are happened and what you want to calculate?
- Mark as New
- Bookmark
- Subscribe
- Mute
- Subscribe to RSS Feed
- Permalink
- Report Inappropriate Content
Hi,
I want to write an expression using variables start_date and end_date as shown in image
I want to show sales between the start_date and end_date. Both start_date and end_date are variables and these are text boxes
Now want to call both the variables in chart by writing expression using set analysis.
I want when user will select an event and will select a corresponding even date (lastDate)
now if user wants to know the sales on pre event date ie sales before 10 days with respect to selected date
and after once we get the date in text box that date will become starting date and last date will be as an event date
so I need to write an expression for start date and end date in pivot chart. How to write an expression?
- Mark as New
- Bookmark
- Subscribe
- Mute
- Subscribe to RSS Feed
- Permalink
- Report Inappropriate Content
Hi Sakshi, there is no data to test in this sample. In reduce data you can select keep possible values to at least have some data to play.
Anyway, the answer should be closer to:
Sum({<Start_Date={">=$(vLastYearDate)<=$(vCurrentYearDate)"}>} MetricField)
vLastYearDate is a variable with value: =Date('$(vCurrentYearDate)'-$(vComparisonDays))
vCurrentYearDate is a variable with value: =Date(lastDate)
- « Previous Replies
-
- 1
- 2
- Next Replies »