Unlock a world of possibilities! Login now and discover the exclusive benefits awaiting you.
- Qlik Community
- :
- All Forums
- :
- QlikView App Dev
- :
- is it possible to only add data points on first da...
Options
- Subscribe to RSS Feed
- Mark Topic as New
- Mark Topic as Read
- Float this Topic for Current User
- Bookmark
- Subscribe
- Mute
- Printer Friendly Page
Turn on suggestions
Auto-suggest helps you quickly narrow down your search results by suggesting possible matches as you type.
Showing results for
Anonymous
Not applicable
2016-05-08
11:59 PM
- Mark as New
- Bookmark
- Subscribe
- Mute
- Subscribe to RSS Feed
- Permalink
- Report Inappropriate Content
is it possible to only add data points on first day of month, qlikview
Hi,
i have created a scatter chart that is listed by week. if i tick "Values on Data Points" the figures just become unlegible. Is it possible to only have the Data Points display on the first day of the week?
Cheers
LC
1,039 Views
3 Replies
MVP
2016-05-09
12:03 AM
- Mark as New
- Bookmark
- Subscribe
- Mute
- Subscribe to RSS Feed
- Permalink
- Report Inappropriate Content
Would you be able to share a sample to play around with? I know we can configure Value on Data Points for bar and line charts, but never used the same for a scatter plot.
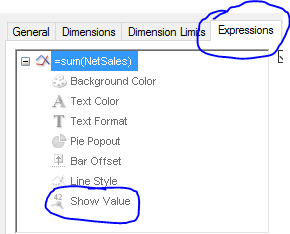
Try playing around with the Show Value option
406 Views
Anonymous
Not applicable
2016-05-09
02:47 AM
Author
- Mark as New
- Bookmark
- Subscribe
- Mute
- Subscribe to RSS Feed
- Permalink
- Report Inappropriate Content
On presentation sheet you have an option to show a limited number of days with an scroll bar.
Regards
406 Views
MVP
2016-05-09
02:53 AM
- Mark as New
- Bookmark
- Subscribe
- Mute
- Subscribe to RSS Feed
- Permalink
- Report Inappropriate Content
For scatter plot showing values on data point is not advisable but you can go for what sunny has suggested
406 Views