Unlock a world of possibilities! Login now and discover the exclusive benefits awaiting you.
- Qlik Community
- :
- All Forums
- :
- QlikView App Dev
- :
- issue on if condition
- Subscribe to RSS Feed
- Mark Topic as New
- Mark Topic as Read
- Float this Topic for Current User
- Bookmark
- Subscribe
- Mute
- Printer Friendly Page
- Mark as New
- Bookmark
- Subscribe
- Mute
- Subscribe to RSS Feed
- Permalink
- Report Inappropriate Content
issue on if condition
Hi
Dimension : Type
i have expression like below:
if(BU=' ROLL',(Count({<Type={'App'},DEPT_L3={'Tech Solutions'},
DEPT={' Services',' Information Solutions','Workflow Solutions','Connected Care & Analytics',
'MHS','MTS Services'}, LC_STAGE={'Concept-Opportunity''},STATE={'Active'},WORK={'Application'}>}LC_STAGE)),
if(BU='ROLL',(Count({<Type={'Infrarad'},DEPT={'MTS '},
DEPT={'Services',' Information Solutions','Workflow Solutions','Connected Care & Analytics',
'MHS','MTS Services'},
LC_STAGE={'Concept-Opportunity'},STATE={'Active'},
WORK={'DCT','Recovery'}>}LC_STAGE)),
when i am applying this expression tp the chart i am getting only one if condition values i.e Type={'App'} but i am not getting Type={'Infrarad'} these vaules could u please help me out
Note : I need to show both Values i.e Type={'Infrarad'},Type={'App'}
- Mark as New
- Bookmark
- Subscribe
- Mute
- Subscribe to RSS Feed
- Permalink
- Report Inappropriate Content
Not 100% sure, but may be this:
If(BU=' ROLL',
RangeSum(Count({<Type = {'App'}, DEPT_L3 = {'Tech Solutions'}, DEPT = {' Services', 'Information Solutions', 'Workflow Solutions', 'Connected Care & Analytics', 'MHS', 'MTS Services'}, LC_STAGE = {'Concept-Opportunity'}, STATE={'Active'}, WORK = {'Application'}>} LC_STAGE),
Count({<Type={'Infrarad'}, DEPT={'MTS '}, DEPT={'Services',' Information Solutions','Workflow Solutions','Connected Care & Analytics','MHS', 'MTS Services'}, LC_STAGE={'Concept-Opportunity'}, STATE={'Active'}, WORK = {'DCT','Recovery'}>} LC_STAGE)
/
RangeSum(Count(TOTAL {<Type = {'App'}, DEPT_L3 = {'Tech Solutions'}, DEPT = {' Services', 'Information Solutions', 'Workflow Solutions', 'Connected Care & Analytics', 'MHS', 'MTS Services'}, LC_STAGE = {'Concept-Opportunity'}, STATE={'Active'}, WORK = {'Application'}>} LC_STAGE),
Count(TOTAL {<Type={'Infrarad'}, DEPT={'MTS '}, DEPT={'Services',' Information Solutions','Workflow Solutions','Connected Care & Analytics','MHS', 'MTS Services'}, LC_STAGE={'Concept-Opportunity'}, STATE={'Active'}, WORK = {'DCT','Recovery'}>} LC_STAGE)
)
- Mark as New
- Bookmark
- Subscribe
- Mute
- Subscribe to RSS Feed
- Permalink
- Report Inappropriate Content
Hi sunny
i am sharing sample document .please go through it and find the percentage of both the values in chart .
Thanks
- Mark as New
- Bookmark
- Subscribe
- Mute
- Subscribe to RSS Feed
- Permalink
- Report Inappropriate Content
What is the expectation here? the bars should add up to 100%?
- Mark as New
- Bookmark
- Subscribe
- Mute
- Subscribe to RSS Feed
- Permalink
- Report Inappropriate Content
Hi sunny,
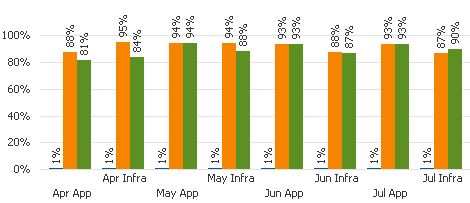
Attached is the sample image for previous months we need like this
- Mark as New
- Bookmark
- Subscribe
- Mute
- Subscribe to RSS Feed
- Permalink
- Report Inappropriate Content
Is this what is required?

- Mark as New
- Bookmark
- Subscribe
- Mute
- Subscribe to RSS Feed
- Permalink
- Report Inappropriate Content
Yup, that is what we required but here is the issue, We have multiple if conditions in our expression, when we are using the expression what you provided is working fine individually. But the same expression we are using with other if conditions its not working properly..For more detail please see the output in attached image which we are getting.
- Mark as New
- Bookmark
- Subscribe
- Mute
- Subscribe to RSS Feed
- Permalink
- Report Inappropriate Content
Difficult to know what you need exactly. I really want to help, but I feel I am not fully aware about your data
- Mark as New
- Bookmark
- Subscribe
- Mute
- Subscribe to RSS Feed
- Permalink
- Report Inappropriate Content
Hi Sunny First of all thanks for your support
I am providing another sample qvw file in that we have multiple conditions.
If I am using individually that was working fine but when we are using with multip[le conditions its not working
For clear idea see attached qvw file
- Mark as New
- Bookmark
- Subscribe
- Mute
- Subscribe to RSS Feed
- Permalink
- Report Inappropriate Content
I think it would be helpful to know what the numbers need to be.
- Mark as New
- Bookmark
- Subscribe
- Mute
- Subscribe to RSS Feed
- Permalink
- Report Inappropriate Content
I am getting correct values for BPS and Canada. I need to get correct values for MTS ROLLUP and the values which you got previously is correct I need to get those values now in mts rollup
Thanks