Unlock a world of possibilities! Login now and discover the exclusive benefits awaiting you.
- Qlik Community
- :
- All Forums
- :
- QlikView App Dev
- :
- logic help!
- Subscribe to RSS Feed
- Mark Topic as New
- Mark Topic as Read
- Float this Topic for Current User
- Bookmark
- Subscribe
- Mute
- Printer Friendly Page
- Mark as New
- Bookmark
- Subscribe
- Mute
- Subscribe to RSS Feed
- Permalink
- Report Inappropriate Content
logic help!
hi All,
I have one filed checkLogic which contain values let say A,,b,c,d,e,f
and two measure
Measure1= count({<Flag={'1'}>}Id/count(Total{<Flag={'0','1'}>}Id
Measure2=count({<Flag={'0'}>}Id/count(Total{<Flag={'0','1'}>}Id
these are representing in BAR Chart, so with dimension value A there are two bar chart, and so on
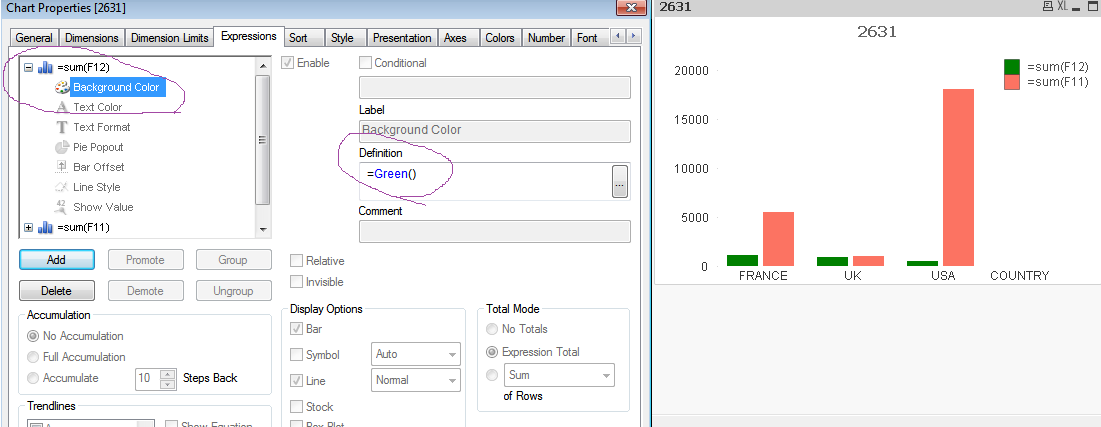
i want to change the color of bar with expression, Measure1 shud be green and measure 2 shud be red.
i know this is very basic, but not happening at my end..
kindly suggest
- Tags:
- new_to_qlikview
- Mark as New
- Bookmark
- Subscribe
- Mute
- Subscribe to RSS Feed
- Permalink
- Report Inappropriate Content
Hi Abhay,
Right click on the chart and go to chart properties. There select colors tab and change the first two colors in the data appearance group.

- Mark as New
- Bookmark
- Subscribe
- Mute
- Subscribe to RSS Feed
- Permalink
- Report Inappropriate Content
try this
- Mark as New
- Bookmark
- Subscribe
- Mute
- Subscribe to RSS Feed
- Permalink
- Report Inappropriate Content
sorry, i forget to mention i m trying this in Qliksense, so i have only option to achieve by Expression..
- Mark as New
- Bookmark
- Subscribe
- Mute
- Subscribe to RSS Feed
- Permalink
- Report Inappropriate Content
sorry abhay i have no idea in qliksense
- Mark as New
- Bookmark
- Subscribe
- Mute
- Subscribe to RSS Feed
- Permalink
- Report Inappropriate Content
but their must be a way can be achieved by calculative expression right.. which we can do both in qlikview and qliksense