Unlock a world of possibilities! Login now and discover the exclusive benefits awaiting you.
- Qlik Community
- :
- All Forums
- :
- QlikView App Dev
- :
- maybe set analysis on calculated value
- Subscribe to RSS Feed
- Mark Topic as New
- Mark Topic as Read
- Float this Topic for Current User
- Bookmark
- Subscribe
- Mute
- Printer Friendly Page
- Mark as New
- Bookmark
- Subscribe
- Mute
- Subscribe to RSS Feed
- Permalink
- Report Inappropriate Content
maybe set analysis on calculated value
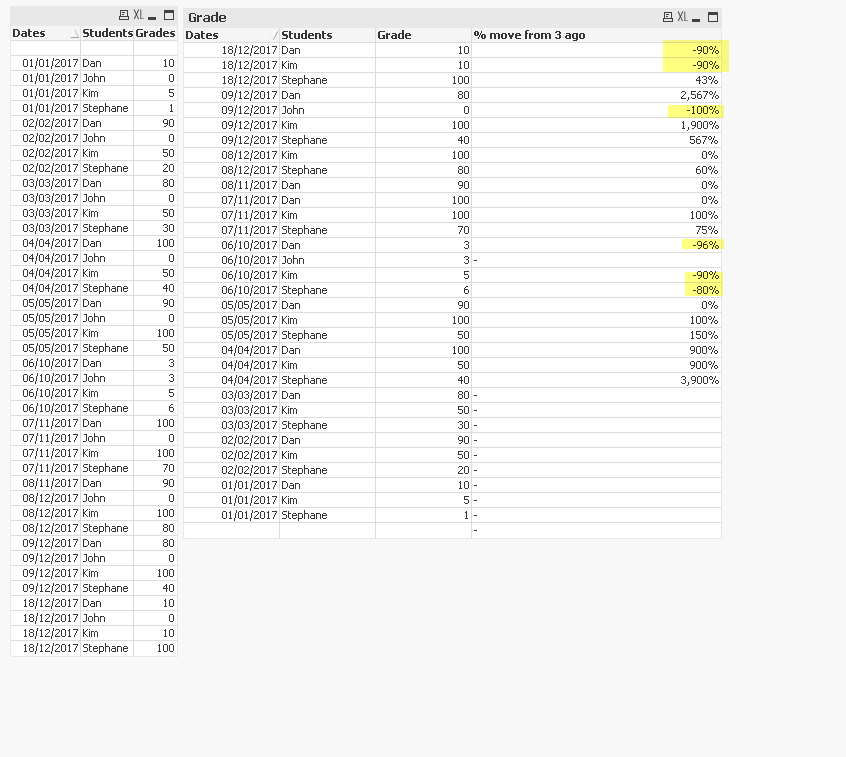
(Thanks to Sunny) I now know how to compare grades from one day with grades from 3 days before - attached
Aggr(Sum(Grades)/Above(Sum(Grades), 3)-1, Students, Dates)
now I am looking to display in a text object the average on negative moves only- so average of
| -90% | -90% | -100% | -96% | -90% | -80% |
so -91.04%
I see 2 possible solutions here I am struggling with both
1) set analysis on the average calculated value of negative only... don't think qlik can do that
2) move the "% move from 3 ago" calculation to the load script then I can use an easy set analysis to get average on negative only.

Any idea?
Thank you.
Raphael
- « Previous Replies
-
- 1
- 2
- Next Replies »
Accepted Solutions
- Mark as New
- Bookmark
- Subscribe
- Mute
- Subscribe to RSS Feed
- Permalink
- Report Inappropriate Content
Try this
=Num(Avg(Aggr(If(Sum(Grades)/Above(Sum(Grades), 3)-1 < 0, Sum(Grades)/Above(Sum(Grades), 3)-1), Students, Dates)), '##.##%')
- Mark as New
- Bookmark
- Subscribe
- Mute
- Subscribe to RSS Feed
- Permalink
- Report Inappropriate Content
Try this
=Num(Avg(Aggr(If(Sum(Grades)/Above(Sum(Grades), 3)-1 < 0, Sum(Grades)/Above(Sum(Grades), 3)-1), Students, Dates)), '##.##%')
- Mark as New
- Bookmark
- Subscribe
- Mute
- Subscribe to RSS Feed
- Permalink
- Report Inappropriate Content
You make it look so simple , thank you very much ![]()
- Mark as New
- Bookmark
- Subscribe
- Mute
- Subscribe to RSS Feed
- Permalink
- Report Inappropriate Content
Sunny, out of interest , is it much complicated to move calculation to loading script (my option 2)
- Mark as New
- Bookmark
- Subscribe
- Mute
- Subscribe to RSS Feed
- Permalink
- Report Inappropriate Content
Might not be too complicated, but it will become static and won't change based on selections.... it will be fixed...
- Mark as New
- Bookmark
- Subscribe
- Mute
- Subscribe to RSS Feed
- Permalink
- Report Inappropriate Content
(fix is ok now), I just was trying before and could not - think above is not accepted in script.
- Mark as New
- Bookmark
- Subscribe
- Mute
- Subscribe to RSS Feed
- Permalink
- Report Inappropriate Content
So, you do want a back end based solution for this?
- Mark as New
- Bookmark
- Subscribe
- Mute
- Subscribe to RSS Feed
- Permalink
- Report Inappropriate Content
yes if possible
- Mark as New
- Bookmark
- Subscribe
- Mute
- Subscribe to RSS Feed
- Permalink
- Report Inappropriate Content
Like this
Table:
LOAD * INLINE [
Dates, Students, Grades, F4
01/01/2017, Dan, 10,
01/01/2017, Kim, 5,
01/01/2017, Stephane, 1,
01/01/2017, John, 0,
02/02/2017, Dan, 90,
02/02/2017, Kim, 50,
02/02/2017, Stephane, 20,
02/02/2017, John, 0,
03/03/2017, Dan, 80,
03/03/2017, Kim, 50,
03/03/2017, Stephane, 30,
03/03/2017, John, 0,
04/04/2017, Dan, 100,
04/04/2017, Kim, 50,
04/04/2017, Stephane, 40,
04/04/2017, John, 0,
05/05/2017, Dan, 90,
05/05/2017, Kim, 100,
05/05/2017, Stephane, 50,
05/05/2017, John, 0,
06/10/2017, Dan, 3,
06/10/2017, Kim, 5,
06/10/2017, Stephane,6,
06/10/2017, John, 3,
07/11/2017, Dan, 100,
07/11/2017, Kim, 100,
07/11/2017, Stephane, 70,
07/11/2017, John, 0,
08/11/2017, Dan, 90,
08/12/2017, Kim, 100,
08/12/2017, Stephane, 80,
08/12/2017, John, 0,
09/12/2017, Dan, 80,
09/12/2017, Kim, 100,
09/12/2017, Stephane, 40,
09/12/2017, John, 0,
18/12/2017, Dan, 10,
18/12/2017, Kim, 10,
18/12/2017, Stephane, 100,
18/12/2017, John, 0,
, , ,
];
TempTable:
LOAD *,
If(Students = Peek('Students', -3), Peek('Grades', -3)) as Above3Grade,
Grades/If(Students = Peek('Students', -3), Peek('Grades', -3)) - 1 as Calc1
Resident Table
Order By Students, Dates;
AggregatedValue:
LOAD Avg(Calc1) as Calc2
Resident TempTable
Where Calc1 < 0;
DROP Table Table;
- Mark as New
- Bookmark
- Subscribe
- Mute
- Subscribe to RSS Feed
- Permalink
- Report Inappropriate Content
I see, Peek ....
Thank you so much
- « Previous Replies
-
- 1
- 2
- Next Replies »