Unlock a world of possibilities! Login now and discover the exclusive benefits awaiting you.
- Qlik Community
- :
- All Forums
- :
- QlikView App Dev
- :
- min(Value)
- Subscribe to RSS Feed
- Mark Topic as New
- Mark Topic as Read
- Float this Topic for Current User
- Bookmark
- Subscribe
- Mute
- Printer Friendly Page
- Mark as New
- Bookmark
- Subscribe
- Mute
- Subscribe to RSS Feed
- Permalink
- Report Inappropriate Content
min(Value)
Hi QV Community,
i have the following table:
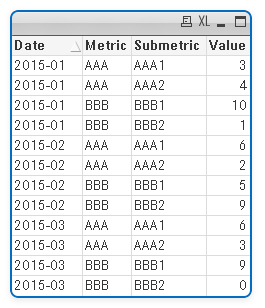
Now i would like create a diagramm with "Date" as dimension and only showing the minimum Value of Metric for the corresponding month.
For example:
2015-01 ---> 3 and 1, so datapoint should be 4
2015-02 ---> 2 and 5, so datapoint should be 7
2015-03 ---> 3 and 0, so datapoint should be 3
Has anybody the clue how to construct the formula??
thx in advance for helping 
Accepted Solutions
- Mark as New
- Bookmark
- Subscribe
- Mute
- Subscribe to RSS Feed
- Permalink
- Report Inappropriate Content
Hi
Try like this
sum(({<UseCaseRelevance={'1'}>}aggr(min({<UseCaseRelevance={'1'}>}Value), Date,Metric))
Please close the thread by marking correct answer & give likes if you like the post.
- Mark as New
- Bookmark
- Subscribe
- Mute
- Subscribe to RSS Feed
- Permalink
- Report Inappropriate Content
1) Use Date as Dimension
2) as Expression:
=sum( aggr( min( Value), Date,Metric))
- Mark as New
- Bookmark
- Subscribe
- Mute
- Subscribe to RSS Feed
- Permalink
- Report Inappropriate Content
Thank you
- Mark as New
- Bookmark
- Subscribe
- Mute
- Subscribe to RSS Feed
- Permalink
- Report Inappropriate Content
One more question:
to get to the above table i had to set some filters.
so the sum(aggr(min( Value), Date,Metric)) is only working for the original table without setting the filters:
But i need to set one filter for "Usecaserelevance=1"
I tried like:
sum(aggr(min(sum({$<UseCaseRelevance={'1'}>}Value)), Date,Metric))
but this is not working
Any ideas?
- Mark as New
- Bookmark
- Subscribe
- Mute
- Subscribe to RSS Feed
- Permalink
- Report Inappropriate Content
Hi
Try like this
sum(({<UseCaseRelevance={'1'}>}aggr(min({<UseCaseRelevance={'1'}>}Value), Date,Metric))
Please close the thread by marking correct answer & give likes if you like the post.