Unlock a world of possibilities! Login now and discover the exclusive benefits awaiting you.
- Qlik Community
- :
- All Forums
- :
- QlikView App Dev
- :
- month order on graph
- Subscribe to RSS Feed
- Mark Topic as New
- Mark Topic as Read
- Float this Topic for Current User
- Bookmark
- Subscribe
- Mute
- Printer Friendly Page
- Mark as New
- Bookmark
- Subscribe
- Mute
- Subscribe to RSS Feed
- Permalink
- Report Inappropriate Content
month order on graph
Hi,
Please see attached. We need the graph to show results in month order on fiscal year (i.e. April through to March).
As you can see it's not showing in order irrespective of 'sort' option.
Can someone please help?
Chris
- Mark as New
- Bookmark
- Subscribe
- Mute
- Subscribe to RSS Feed
- Permalink
- Report Inappropriate Content
Hi,
Put this in script but it doesn't like MinDate and MaxDate and can you clarify 'RESIDENT factable'?
Set vFM = 4 ; // First month of fiscal year
Calendar:
Load Dual(fYear-1 &'/'& fYear, fYear) as FYear, // Dual fiscal year
Dual(Month, fMonth) as FMonth, // Dual fiscal month
*;
Load Year + If(Month>=$(vFM), 1, 0) as fYear, // Numeric fiscal year
Mod(Month-$(vFM), 12)+1 as fMonth, // Numeric fiscal month
*;
LOAD
Date(Date) AS [Date of request],
Year(Date) AS Year,
'Q' & Ceil(Month(Date) / 3) AS Quarter,
Month(Date) As Month,
Day(Date) As Day,
Week(Date) As Week;
Load Date(MinDate + IterNo() -1 ) AS Date While (MinDate + IterNo() - 1) <= Num(MaxDate);
Load
Min([Date of request]) AS MinDate,
Max([Date of request]) AS MaxDate
RESIDENT factable;
- Mark as New
- Bookmark
- Subscribe
- Mute
- Subscribe to RSS Feed
- Permalink
- Report Inappropriate Content
Hi Fray
Just Add below script -
LOAD * INLINE [
Month, SEQ
Jan, 1
Feb, 2
March, 3
April, 4
May, 5
Jun, 6
Jul, 7
Aug, 8
Sep, 9
Oct, 10
Nov, 11
Dec, 12
];
Please update Month values as you have in your excel.
In graph at sort tab assign SEQ
It will resolve your problem simple way.
Regards,
Lokesh
- Mark as New
- Bookmark
- Subscribe
- Mute
- Subscribe to RSS Feed
- Permalink
- Report Inappropriate Content
which table contains [Date of request] fields
- Mark as New
- Bookmark
- Subscribe
- Mute
- Subscribe to RSS Feed
- Permalink
- Report Inappropriate Content
Its in the main spreadsheet we are loading all our data in (this spreadsheet contains about 15 other columns of text).
- Mark as New
- Bookmark
- Subscribe
- Mute
- Subscribe to RSS Feed
- Permalink
- Report Inappropriate Content
is ok.
your loading record from excel file like below and On top assign table name like Sales
Sales :
LOAD *
FROM
D:\Test.xlsx
(ooxml, embedded labels, table is master_table);
that table name taking in the resident
Set vFM = 4 ; // First month of fiscal year
Calendar:
Load Dual(fYear-1 &'/'& fYear, fYear) as FYear, // Dual fiscal year
Dual(Month, fMonth) as FMonth, // Dual fiscal month
*;
Load Year + If(Month>=$(vFM), 1, 0) as fYear, // Numeric fiscal year
Mod(Month-$(vFM), 12)+1 as fMonth, // Numeric fiscal month
*;
LOAD
Date(Date) AS [Date of request],
Year(Date) AS Year,
'Q' & Ceil(Month(Date) / 3) AS Quarter,
Month(Date) As Month,
Day(Date) As Day,
Week(Date) As Week;
Load Date(MinDate + IterNo() -1 ) AS Date While (MinDate + IterNo() - 1) <= Num(MaxDate);
Load
Min([Date of request]) AS MinDate,
Max([Date of request]) AS MaxDate
RESIDENT sales;
- Mark as New
- Bookmark
- Subscribe
- Mute
- Subscribe to RSS Feed
- Permalink
- Report Inappropriate Content
This loads; however, chart still isn't correct.
I have changed dimension to FMonth (which generates from your script); however, it then only shows one value:
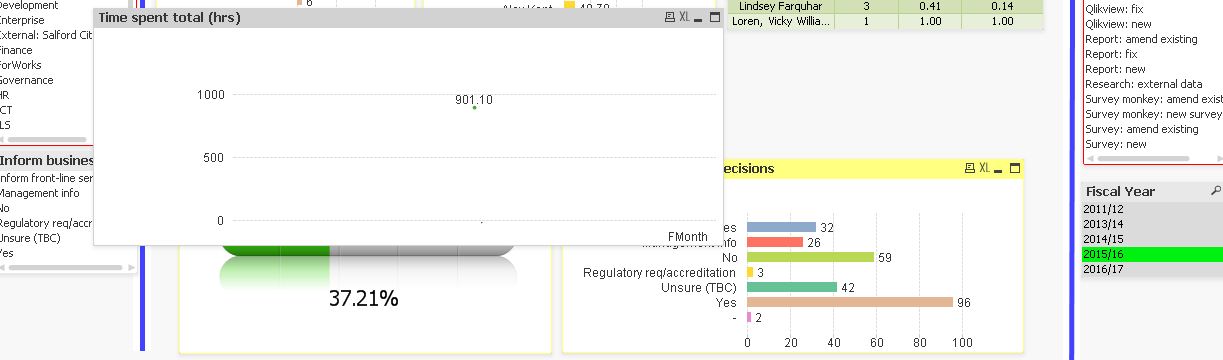
The 901.10 is the sum of time spent; however, its only recognising the year, not the months on the x axis.
- Mark as New
- Bookmark
- Subscribe
- Mute
- Subscribe to RSS Feed
- Permalink
- Report Inappropriate Content
is possible to upload sample application?
- Mark as New
- Bookmark
- Subscribe
- Mute
- Subscribe to RSS Feed
- Permalink
- Report Inappropriate Content
see atatched
- Mark as New
- Bookmark
- Subscribe
- Mute
- Subscribe to RSS Feed
- Permalink
- Report Inappropriate Content
Change your dimension to =MonthName(Date([Month-Year],'DD/MM/YYYY')) in add Calculated dimension.
- Mark as New
- Bookmark
- Subscribe
- Mute
- Subscribe to RSS Feed
- Permalink
- Report Inappropriate Content
Hi Chris,
creating Synthetic Keys so only getting single record. comment Month and Year field in Timespent table