Unlock a world of possibilities! Login now and discover the exclusive benefits awaiting you.
- Qlik Community
- :
- All Forums
- :
- QlikView App Dev
- :
- need help urgt
- Subscribe to RSS Feed
- Mark Topic as New
- Mark Topic as Read
- Float this Topic for Current User
- Bookmark
- Subscribe
- Mute
- Printer Friendly Page
- Mark as New
- Bookmark
- Subscribe
- Mute
- Subscribe to RSS Feed
- Permalink
- Report Inappropriate Content
need help urgt
Hi i hav 2 charts
i have clicked on 1 chart , the 1st chart data wll be displaying and aslo 2 chart related data also displaying ,
then if i want to drill down o 2 chart .
if am drillin down on 2 chart , the 1st chart dat hould not get reflectd, wat ever first i have clicked on the 1st chart that as to get pop up
ex: i have sales on country wise on month wise
1st chart will be countries wise
India, aregntina, canada based n month wise sales,
if i click on 1st chart india , the data will how up.
in the secnd chart , the states wise data will show .
Now my requirement is
if i go to second chart and click on statewise data,
the first chart inia wouldbe like that ony , it should not refelect , how
- « Previous Replies
-
- 1
- 2
- Next Replies »
- Mark as New
- Bookmark
- Subscribe
- Mute
- Subscribe to RSS Feed
- Permalink
- Report Inappropriate Content
In the first chart use set analysis expressions to overrule the state selection. For example sum(amount) would become sum({<state=>}amout) if your state field has the name state.
talk is cheap, supply exceeds demand
- Mark as New
- Bookmark
- Subscribe
- Mute
- Subscribe to RSS Feed
- Permalink
- Report Inappropriate Content
hi suppose i have in first chart expression
count(DISTINCT{<Testing]={'Yes'},Year = {$(vMaxYear)}>}ID)
in the chart back ground color as
=If(GetSelectedCount(NAME)>0,
if(count(DISTINCT{<Testing]={'Yes'},Year = {$(vMaxYear)}>}ID)SUM({<Refline={'inbound'}>}Refvalue),rgb(117, 238, 7),
if(count(DISTINCT{<[Testing]={'Yes'},Year = {$(vMaxYear)}>}SRV_OUT_ID)>SUM({<Refline={'outbound'}>}Refvalue),rgb(238, 24, 7), rgb(238, 237, 7) )),rgb(141,170,203))
and in the second chart expression is as
count(DISTINCT{<[Testing]={'Yes'},Year = {$(vMaxYear)}>}ID)
and in the background color as
=If(GetSelectedCount(CI)>0,
=If(GetSelectedCount(CI)>0,
if(count(DISTINCT{<Testing]={'Yes'},Year = {$(vMaxYear)}>}ID)SUM({<Refline={'inbound'}>}Refvalue),rgb(117, 238, 7),
if(count(DISTINCT{<[Testing]={'Yes'},Year = {$(vMaxYear)}>}SRV_OUT_ID)>SUM({<Refline={'outbound'}>}Refvalue),rgb(238, 24, 7), rgb(238, 237, 7) )),rgb(141,170,203))
how to do
- Mark as New
- Bookmark
- Subscribe
- Mute
- Subscribe to RSS Feed
- Permalink
- Report Inappropriate Content
Do what?
talk is cheap, supply exceeds demand
- Mark as New
- Bookmark
- Subscribe
- Mute
- Subscribe to RSS Feed
- Permalink
- Report Inappropriate Content
I will explain you clearly
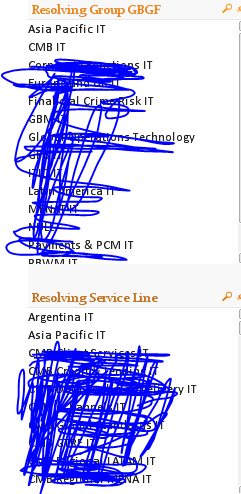
I have 2 filters
GB/GF and service lines
and i have 2 charts
with GB/GF and Service lines
If i click on 1st chart of GB,GF thecorrsponding chart will appear and aslo in the second chart Corresponding service lines will appear based on month wise data
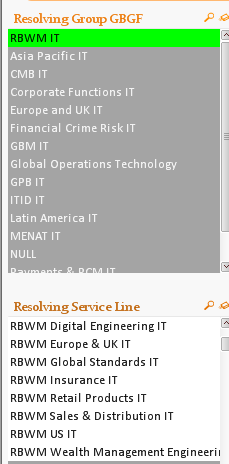
now if i slect on RBWM it in firs filter the corresponding second filetr
also in the 1st cart(based on GB/gf) ad in the second chart rsolvings ervice line data will show
and in if i futhur click on second filter, the first chart should not reflect , it will show only RBWM data
here first graph aslo reflecting , ca i know how to not reflect the first hart , if i furthur click on second chart
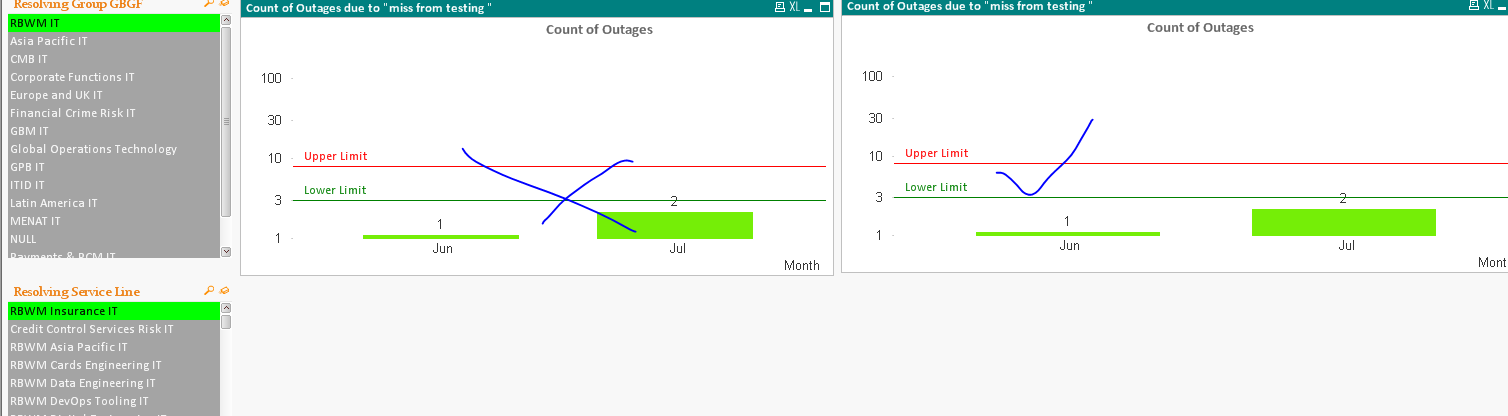
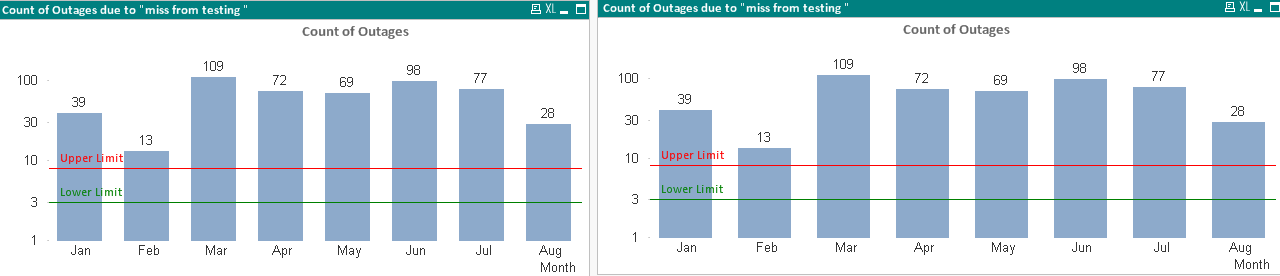
in the first chart
the chart will be like below
- Mark as New
- Bookmark
- Subscribe
- Mute
- Subscribe to RSS Feed
- Permalink
- Report Inappropriate Content
As Gysbert mentioned, include the field you want to exclude in the aggregation function of the respective chart.
Perhaps based on your example above, something like
count(DISTINCT{<Testing]={'Yes'},Year = {$(vMaxYear)}, [Resolving Service Line] = >}ID)
Assuming the second listbox has such name.
- Mark as New
- Bookmark
- Subscribe
- Mute
- Subscribe to RSS Feed
- Permalink
- Report Inappropriate Content
in the 1st chart dimension i have kept as month andin the exprssion as
count(DISTINCT{<[Miss from Testing]={'Yes'},Year = {$(vMaxYear)}>}SRV_OUT_ID)
and in the background color as
=If(GetSelectedCount(RES_GBGF_NAME)>0,
if(count(DISTINCT{<[Miss from Testing]={'Yes'},Year = {$(vMaxYear)}>}SRV_OUT_ID)<=SUM({<Refline={'inbound'}>}Refvalue),rgb(117, 238, 7),
if(count(DISTINCT{<[Miss from Testing]={'Yes'},Year = {$(vMaxYear)}>}SRV_OUT_ID)>SUM({<Refline={'outbound'}>}Refvalue),rgb(238, 24, 7), rgb(238, 237, 7)
)),rgb(141,170,203))
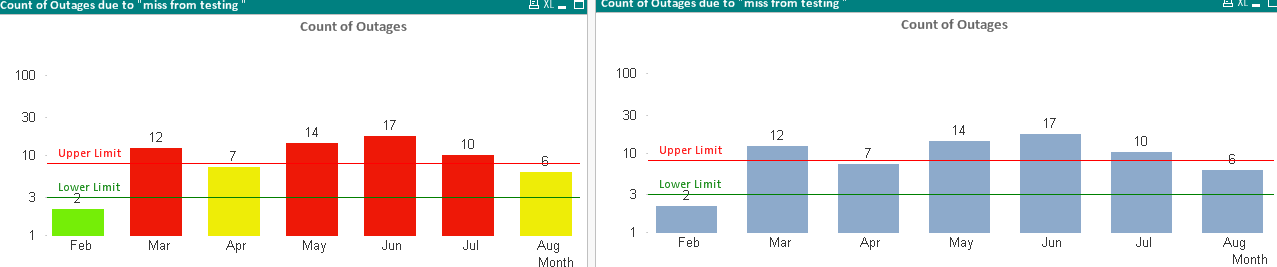
secon chart
count(DISTINCT{<[Miss from Testing]={'Yes'},Year = {$(vMaxYear)}>}SRV_OUT_ID)
and in the background colour as
=If(GetSelectedCount(RES_SL_CI_NAME)>0,
if(count(DISTINCT{<[Miss from Testing]={'Yes'},Year = {$(vMaxYear)}>}SRV_OUT_ID)<=SUM({<Refline={'inbound'}>}Refvalue),rgb(117, 238, 7),
if(count(DISTINCT{<[Miss from Testing]={'Yes'},Year = {$(vMaxYear)}>}SRV_OUT_ID)>SUM({<Refline={'outbound'}>}Refvalue),rgb(238, 24, 7), rgb(238, 237, 7)
)),rgb(141,170,203))
- Mark as New
- Bookmark
- Subscribe
- Mute
- Subscribe to RSS Feed
- Permalink
- Report Inappropriate Content
Apply as above: use the field behind the listbox "Resolving Service Line" in the second chart with the "=" and the right part empty, which means that it will ignore whatever selection you are doing in that listbox while keeping the selections from anywhere else.
- Mark as New
- Bookmark
- Subscribe
- Mute
- Subscribe to RSS Feed
- Permalink
- Report Inappropriate Content
not coming
please check my expressions as i have give above
- Mark as New
- Bookmark
- Subscribe
- Mute
- Subscribe to RSS Feed
- Permalink
- Report Inappropriate Content
count(DISTINCT{<[Miss from Testing]={'Yes'},Year = {$(vMaxYear)}, [Resolving Service Line] = >} SRV_OUT_ID)
- « Previous Replies
-
- 1
- 2
- Next Replies »