Unlock a world of possibilities! Login now and discover the exclusive benefits awaiting you.
- Qlik Community
- :
- All Forums
- :
- QlikView App Dev
- :
- odd problem
- Subscribe to RSS Feed
- Mark Topic as New
- Mark Topic as Read
- Float this Topic for Current User
- Bookmark
- Subscribe
- Mute
- Printer Friendly Page
- Mark as New
- Bookmark
- Subscribe
- Mute
- Subscribe to RSS Feed
- Permalink
- Report Inappropriate Content
odd problem
Hi All
I have a chart showing time bands daily and monthly.
I am having problems where I can see the daily incidents in the month of June but not May
and I can choose daily dates by mouse drag but randomly it comes up with "Drawing of chart failed internally".
I work in health so paranoid about sending qvw files ...
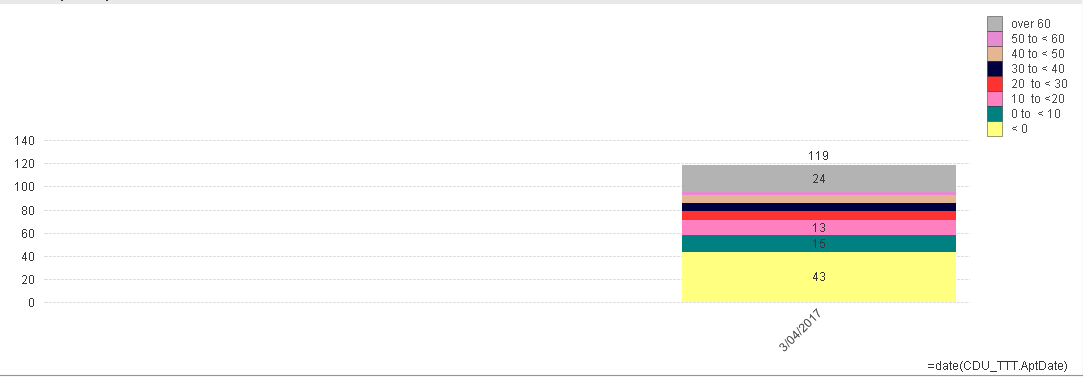
Daily chart appears so:

when I use the calendar object to choose the dates of interest - appears so

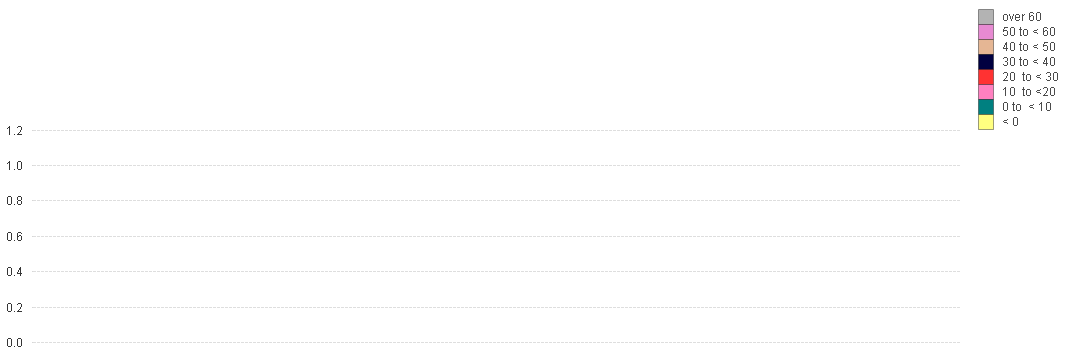
I choose May from the Listbox: =monthname(CDU_TTT.AptDate)

it fails ... but June is ok
Jo
- Mark as New
- Bookmark
- Subscribe
- Mute
- Subscribe to RSS Feed
- Permalink
- Report Inappropriate Content
Not sure about your formula and data. However, can you try the below settings in your chart.
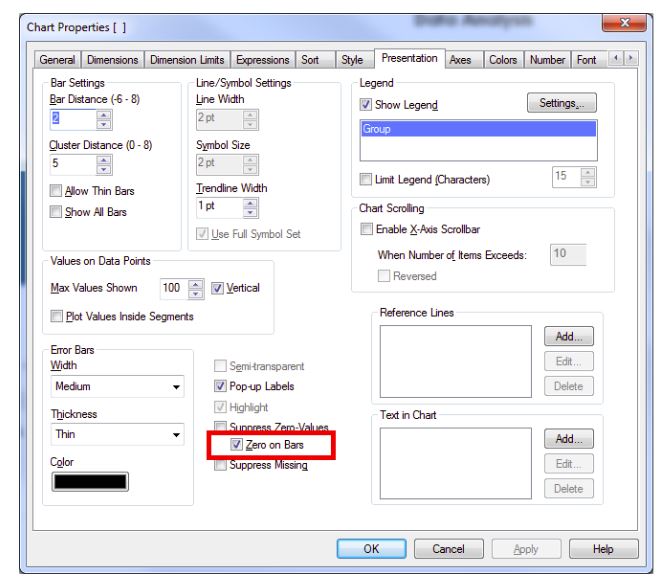
Siva
- Mark as New
- Bookmark
- Subscribe
- Mute
- Subscribe to RSS Feed
- Permalink
- Report Inappropriate Content
Hi Jo,
Hard to tell without having the app itself to work on or the expression your using.
I tested with some dummy data here and works fine I guess.
Attached the file I used.
Regards,
Felipe.
- Mark as New
- Bookmark
- Subscribe
- Mute
- Subscribe to RSS Feed
- Permalink
- Report Inappropriate Content
Hi Felipe
Spreadsheet shows the data that is used in the month of April.
Individually days are shown thus:
April 1

April 2
April 3
April 1 has only 1 record, April 2 has 0 records ...
Jo
- Mark as New
- Bookmark
- Subscribe
- Mute
- Subscribe to RSS Feed
- Permalink
- Report Inappropriate Content
Hi Jo,
Your data works fine here when loaded.
I would assume its something with your calculated dimension or the expression. Instead of creating the dimension, use the same function on load statement to create the field, it's way better for performance than calculated dimension.
Tested both ways and works okay, but I don't have the complete data set or the expression, so I'm basing on a hunch.
Used this thread Creating A Master Calendar to create the calendar but all seems to be working fine.
Hope it helps,
Felipe.
- Mark as New
- Bookmark
- Subscribe
- Mute
- Subscribe to RSS Feed
- Permalink
- Report Inappropriate Content
Hi Felip
thanks for your help - I am not at work and so cannot open the qlikview file, but I have been playing around with Master Calendars. I have finally seen the elegance of the Master Calendar and how it works ... I need to discuss it though under another general discussion. I will get back to you on this particular discussion.
Jo