Unlock a world of possibilities! Login now and discover the exclusive benefits awaiting you.
- Qlik Community
- :
- All Forums
- :
- QlikView App Dev
- :
- pivot display partial column sum in the middle of ...
- Subscribe to RSS Feed
- Mark Topic as New
- Mark Topic as Read
- Float this Topic for Current User
- Bookmark
- Subscribe
- Mute
- Printer Friendly Page
- Mark as New
- Bookmark
- Subscribe
- Mute
- Subscribe to RSS Feed
- Permalink
- Report Inappropriate Content
pivot display partial column sum in the middle of table
Hi
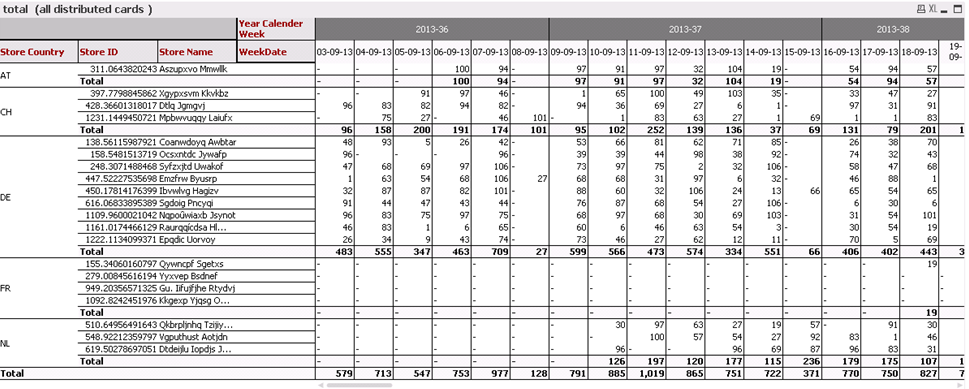
i wanted to know how to get partial sums of a Dimension (WeekDate) displayed after a second Dimension (Year Calender Week). The Expression is a sum(customer)
for ex. from the Chart the partial sum of Week Date shall be : 100+ 94+97= 291 (values only for days of the corresponding week). This value shall appear after the field ; 08-09-13, which is the last day of the week 2013-36 ( and not at the end of the table)
thanks
Accepted Solutions
- Mark as New
- Bookmark
- Subscribe
- Mute
- Subscribe to RSS Feed
- Permalink
- Report Inappropriate Content
Hi Felipe have you looked at the partial sums option in the presentation tab of the chart properties?
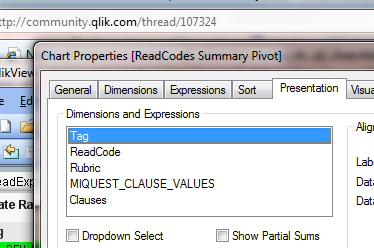
Select your dimension, then check "show partial sums"
does this work for you?
Erica
- Mark as New
- Bookmark
- Subscribe
- Mute
- Subscribe to RSS Feed
- Permalink
- Report Inappropriate Content
Hi Felipe have you looked at the partial sums option in the presentation tab of the chart properties?
Select your dimension, then check "show partial sums"
does this work for you?
Erica
- Mark as New
- Bookmark
- Subscribe
- Mute
- Subscribe to RSS Feed
- Permalink
- Report Inappropriate Content
thanks Erika, i.... thought i checked it 🙂