Unlock a world of possibilities! Login now and discover the exclusive benefits awaiting you.
- Qlik Community
- :
- All Forums
- :
- QlikView App Dev
- :
- pivot table
- Subscribe to RSS Feed
- Mark Topic as New
- Mark Topic as Read
- Float this Topic for Current User
- Bookmark
- Subscribe
- Mute
- Printer Friendly Page
- Mark as New
- Bookmark
- Subscribe
- Mute
- Subscribe to RSS Feed
- Permalink
- Report Inappropriate Content
pivot table
Hi All,
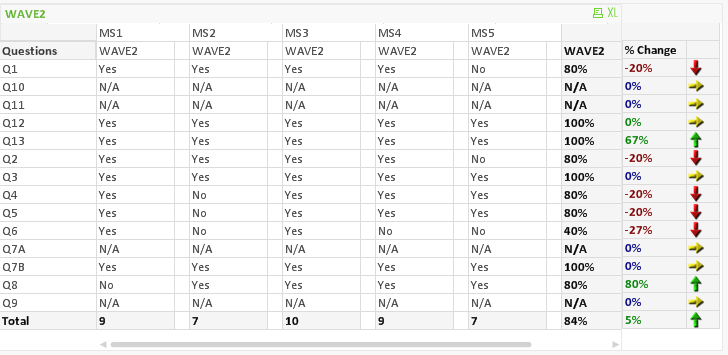
I need to display the description for each questions (Q1,Q2.......Q13) and sort it.
I don't have the questions description in database. How can i do it ?
Below is thescript.
Crosstable(Questions, Value,4)
SQL SELECT MYSTERY_SHOPPER, DEALER, COUNTRY, WAVE, Q1, Q2, Q3, Q4, Q5,Q6,Q7A,Q7B,Q8,Q9,Q10,Q11,Q12,Q13,
FROM TABLE WHERE ENABLED='YES';
Below is the pivot table.
Thanks,
Selva
- Tags:
- new_to_qlikview
- pivot
Accepted Solutions
- Mark as New
- Bookmark
- Subscribe
- Mute
- Subscribe to RSS Feed
- Permalink
- Report Inappropriate Content
- Mark as New
- Bookmark
- Subscribe
- Mute
- Subscribe to RSS Feed
- Permalink
- Report Inappropriate Content
Hi Selva,
Follow the below approaches:
1:Use inline table to add the description for all the Question and use the same in your qlikview application and for sorting in same inline add one more column with number and use this in sorting.
2: Maintain the Question name and description in a separate Excel sheet, so that it will be easy to maintain.
And load this data to the app and use it.
Hope this helps you!!!
Regards,
@vi
- Mark as New
- Bookmark
- Subscribe
- Mute
- Subscribe to RSS Feed
- Permalink
- Report Inappropriate Content
HI Avinash,
i created the inline table
QUEST_CODE:
LOAD * Inline [
QUEST_ID,QUEST_DESCRIPTION
1,QUESTION1
2,QUESTION2
];
But how can i match this with questions?
Thanks,
Selva
- Mark as New
- Bookmark
- Subscribe
- Mute
- Subscribe to RSS Feed
- Permalink
- Report Inappropriate Content
Hi Selva
Use Left Join between your Table and Inline Table.
See Below:
YourTable:
Load
MYSTERY_SHOPPER,
DEALER,
COUNTRY,
WAVE,
Questions,
Value
FROM ........./.qvd(qvd);
Left Join
QUEST_CODE:
LOAD * Inline [
Questions,QUEST_DESCRIPTION
Q1,QUESTION1
Q2,QUESTION2
...
...
Q13,QUESTION13
];
After doing Reload, use QUEST_DESCRIPTION in your Pivot Table. It will give you the desired Result.
Regards
Aviral Nag
- Mark as New
- Bookmark
- Subscribe
- Mute
- Subscribe to RSS Feed
- Permalink
- Report Inappropriate Content
Hi Selva,
Please follow as told by Nag Aviral ......... If u still face any issue please post your app.
Regards,
@vi
- Mark as New
- Bookmark
- Subscribe
- Mute
- Subscribe to RSS Feed
- Permalink
- Report Inappropriate Content
Hi Aviral Nag,
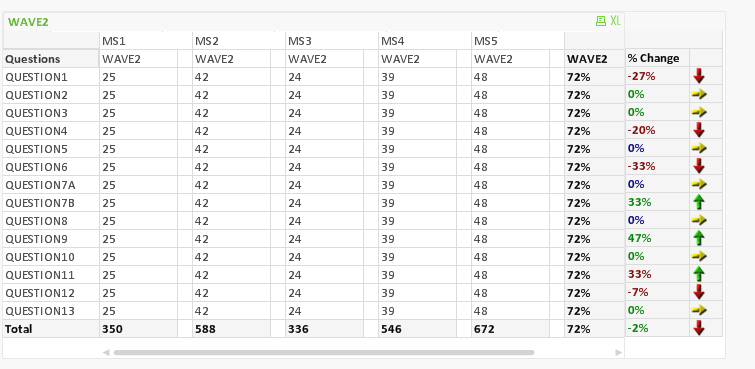
I tried but my calculation went wrong.
Dimension used before this change
=if (Match(Questions,'Q1','Q2','Q3','Q4','Q5','Q6','Q7A','Q7B','Q8','Q9','Q10','Q11','Q12','Q13'),Questions)
MYSTERY_SHOPPER
Expression
if ( SecondaryDimensionality()=1 ,
if ( sum(Alt(Value,0)) = 1 , Dual('Yes',1) , if ( sum(Alt(Value,0)) = 0 , Dual('No',0), if ( sum(Alt(Value,0)) = -1 , Dual('N/A',0) , sum({<Value={'1','0'}>}[Value])))),
num(sum ({<Questions={'Q1','Q2','Q3','Q4','Q5','Q6','Q7A','Q7B','Q8','Q9','Q10','Q11','Q12','Q13'},WAVE={'WAVE2'},Value={'1','0'}>}Alt(Value,0))/
count ({<Questions={'Q1','Q2','Q3','Q4','Q5','Q6','Q7A','Q7B','Q8','Q9','Q10','Q11','Q12','Q13'},WAVE={'WAVE2'},Value={'1','0'}>} Value ),'0%' ) )
Below is the pivot table

- Mark as New
- Bookmark
- Subscribe
- Mute
- Subscribe to RSS Feed
- Permalink
- Report Inappropriate Content
Hi Avinash,
Kindly find the attached QV file.
Appreciate if you could help me.
Thanks,
Selva
- Mark as New
- Bookmark
- Subscribe
- Mute
- Subscribe to RSS Feed
- Permalink
- Report Inappropriate Content
Kindly Rename your Field Names
Questions is your Original Field Name which contains values Q1, Q2,.......,Q13
Create QUEST_DESCRIPTION field name which contains values QUESTION1, QUESTION2,.......
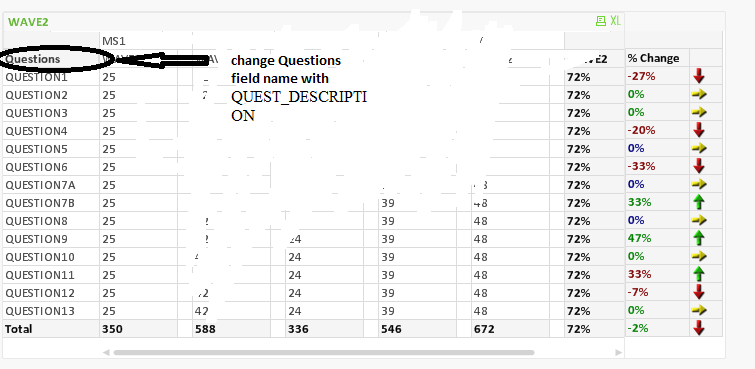
The above renaming is done in the Backend.
- Mark as New
- Bookmark
- Subscribe
- Mute
- Subscribe to RSS Feed
- Permalink
- Report Inappropriate Content
See the Attachment.
I have also done the Sorting of Questions.
- Mark as New
- Bookmark
- Subscribe
- Mute
- Subscribe to RSS Feed
- Permalink
- Report Inappropriate Content
Thanks a lot Nag Aviral & Avinash R