Unlock a world of possibilities! Login now and discover the exclusive benefits awaiting you.
- Qlik Community
- :
- All Forums
- :
- QlikView App Dev
- :
- potential AGGR solution needed?
- Subscribe to RSS Feed
- Mark Topic as New
- Mark Topic as Read
- Float this Topic for Current User
- Bookmark
- Subscribe
- Mute
- Printer Friendly Page
- Mark as New
- Bookmark
- Subscribe
- Mute
- Subscribe to RSS Feed
- Permalink
- Report Inappropriate Content
potential AGGR solution needed?
Hi again
my problem today is from Telco busines and I must do a calculation that is based on a table that changes depending on selections made.
The case (simplified):
I have to calculate the cost for cables when building cable routes for one or multiple regions.
I have regions that are using cable routes. This relation is shown in Table 1. Some cables are used by one region only, some by multiple regions.
Table 1
| region | cable | length | cost/length | cost |
| A | 1 | 5.4 | 5 | 27 |
| A | 2 | 3.5 | 5 | 17.5 |
| A | 3 | 1.2 | 5 | 6 |
| A | 4 | 20.4 | 5 | 102 |
| B | 3 | 1.2 | 5 | 6 |
| B | 4 | 20.4 | 5 | 102 |
| B | 5 | 3 | 5 | 15 |
| C | 4 | 20.4 | 5 | 102 |
| C | 6 | 7.8 | 5 | 39 |
Given constant cost per cable the task would be to ensure that each cable is only selected once when multiple regions are selected. E.g. when choosing Region A and C, the cost (length*price) for the cables 1,2,3,4 and 6 must be summed up, ensuring that cable 4 is only added once.
This can be done with aggr and distinct like this:
SUM(AGGR(SUM(DISTINCT cost), cable))
(don't ask me why we have to use DISTINCT cost and not DISTINCT cable ,
but it works fine.)
Unfortunately it is not as easy....
The cost/length is not constant, but a function of several parameters AND it is related to the question if a cable is used by one region only or by multiple regions. In the second case, some parameters like length and type remain, but the load parameters must be added up
Including the dynamic cost parameters, we get
Table 2
| region | cable | length | type | load a | load b |
| A | 1 | 5.4 | fiber | 0 | 1 |
| A | 2 | 3.5 | copper | 0 | 2 |
| A | 3 | 1.2 | copper | 1 | 3 |
| A | 4 | 20.4 | fiber | 1 | 4 |
| B | 3 | 1.2 | copper | 0 | 5 |
| B | 4 | 20.4 | fiber | 1 | 6 |
| B | 5 | 3 | copper | 1 | 7 |
| C | 4 | 20.4 | fiber | 0 | 8 |
| C | 6 | 7.8 | fiber | 1 | 9 |
Now comes the calculation of the cost per cable. I simplify again but the model is similar. Table 3 shows the cost/length calculation:
Table3
| type | load a | load b | cost/length |
| copper | =0 | <5 | 3 |
| copper | =0 | 5-10 | 4 |
| copper | =0 | >10 | 5 |
| copper | >0 | <5 | 12 |
| copper | >0 | 5-10 | 14 |
| copper | >0 | >10 | 16 |
| fiber | =0 | <5 | 35 |
| fiber | =0 | 5-10 | 45 |
| fiber | =0 | >10 | 55 |
| fiber | >0 | <5 | 100 |
| fiber | >0 | 5-10 | 120 |
| fiber | >0 | >10 | 140 |
What we have to do now when e.g. Region A and C is selected is:
1. Define which cables are used (1,2,3,4 and 6)
2. For each cable calculate sum(load a) and sum(load b) in case it is used twice.
3. Use table 3 to define the cost/length for each cable
4. Get the cost for each cable used (=length*cost/length)
5. add up the cost for all used cables.
The result should be like this
Table4
| region | cable | length | type | load a | load b | cost/length | cost |
| A | 1 | 5.4 | fiber | 0 | 1 | 35 | 189 |
| A | 2 | 3.5 | copper | 0 | 2 | 3 | 10.5 |
| A | 3 | 1.2 | copper | 1 | 3 | 12 | 14.4 |
| A+C | 4 | 20.4 | fiber | 1+0 | 4+8 | 140 | 2856 |
| C | 6 | 7.8 | fiber | 1 | 9 | 120 | 936 |
| total: | 4005.9 |
The OUTPUT of all this should be just one KPI-field that gives me the total of 4005.9 in this example.
How would the formula above look like now?
Hope anyone has an idea.... note we do NOT talk about load scripting but chart formulas.
- Mark as New
- Bookmark
- Subscribe
- Mute
- Subscribe to RSS Feed
- Permalink
- Report Inappropriate Content
Hi Michael,
I think the most difficult thing isn't the aggr() else to match the appropriate cost/length to type and load a/b. I'm not sure if it could be done without multiple nested if-loops and if you could avoid a hard-coding of the conditions for it respectively the use of table 3 as it is would mean to concat the values of the columns and extracting them again with string-functions to get the numbers and their operators within the conditions.
Personally I wouldn't try it else I would match these values within the script or at least building there a help-table - and yes I have seen your comment about chart formulas.
This meant I would create a kind of intervalmatch-table (although it's in my suggestion created with while-loops over created from-to areas of load a/b) and use it either as source for a mapping table to add the values to your table 2 or using it as an additionally dimension-table:
load *, rowno() as RowNo;
load *, iterno() as I2, b1 + iterno() - 1 as B while b1 + iterno() - 1 <= b2;
load *, iterno() as I1, a1 + iterno() - 2 as A while a1 + iterno() <= a2;
load *,
if(left([load a], 1) = '=', 1, 2) as a1, if(left([load a], 1) = '=', 2, 4) as a2,
if(left([load b], 1) = '<', 1, if(left([load b], 1) = '>',
replace([load b], '>', '') + 1, subfield([load b], '-', 1))) as b1,
if(left([load b], 1) = '<', replace([load b], '<', '') - 1,
if(left([load b], 1) = '>', 20, subfield([load b], '-', 2))) as b2;
load *, recno() as RecNo inline [
type load a load b cost/length
copper =0 <5 3
copper =0 5-10 4
copper =0 >10 5
copper >0 <5 12
copper >0 5-10 14
copper >0 >10 16
fiber =0 <5 35
fiber =0 5-10 45
fiber =0 >10 55
fiber >0 <5 100
fiber >0 5-10 120
fiber >0 >10 140
] (txt, delimiter is \t);
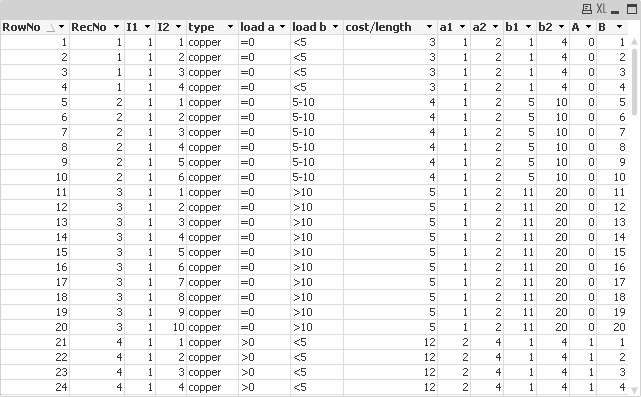
If load a/b is already properly defined you wouldn't need the extra stuff of a1/a2/b1/b here for controlling the loop.
With this I could imagine the following as expression for your KPI:
SUM(AGGR(SUM(length * cost/length), cable, region))
Maybe you need one or two further aggr() inside or outside from the above expression depending on the real data/datamodel, for example if 20.4 is the total length of cable4 for the regions A+C but containing in both records so that you need to use an additionally avg() for it. Probably there are some more similar adjustements needed.
Even if you couldn't implement it in this way I hope it gives you some ideas to resolve this task.
- Marcus
- Mark as New
- Bookmark
- Subscribe
- Mute
- Subscribe to RSS Feed
- Permalink
- Report Inappropriate Content
Hi Marcus,
thanks for the ideas.Indeed it might be good to script some help-table during load to avoid intensive if-Loops in the frontend formula.
My main concern is still that I cannot predict which regions will be combined and if I would prepare a table in the script that contains all potential combinations of regions that share a cable, this would blow up the data model by far too much with 20mio cables just for 10% of the Country.
One thing I learned today is that we do not need the interval matching. We can simply look whether load A and B are =0 or not. Remains the problem of aggregation on the fly.
Why I assumed that aggr is a way forward is the following: Based on table 4 it would be pretty easy to calculate the cost for the cables. And I leaned that AGGR() basically creates a virtual/internal table based on which then the final calculation is done. Now I try to figure out how I could use aggr to sum up the two load parameters for every cable that occurs multiple times in the filtered raw data, before I then calculate the cost out of the aggregated parameters.
Difficult to discribe in words. I will experiment a bit more and then send an update.
Keep Qliking
Michael
- Mark as New
- Bookmark
- Subscribe
- Mute
- Subscribe to RSS Feed
- Permalink
- Report Inappropriate Content
Hi Michael,
ok, the combinations of regions and cables are unpredictable. I assume this meant that not the length of a single cable defined the cost/length per cable else the sum of multiple cables. In this case you couldn't add these values directly within the script with a mapping-approach and also not using such a table as a dimension table. Also your mentioned as-of-table (cartesian combination of all possible combination) as a link-table is probably much too heavy as to be practically.
But I think you could use such (interval) matching-table (just a kind of cartesian combination over all possible cost-combinations with probably just a few thousands records) as an island-table containing a key of type & '|' & A & '|' & B and the cost/length value and within the expression you might use something like:
fieldvalue('cost/length', fieldindex('Key', type & '|' & A & '|' & B))
to pick the right value for cost/length.
Maybe it needs to be constructed a bit different and maybe better with a pick(match()) approach but I think it must in any way go in this general direction - to pick the right value and not to evaluate them with multiple conditions.
- Marcus
- Mark as New
- Bookmark
- Subscribe
- Mute
- Subscribe to RSS Feed
- Permalink
- Report Inappropriate Content
Hi everybody,
meanwhile I found a solution. Actually it is a mixture of what i found in various threds here and to be honest I cannot quote in detail.
Basically the structure is
SUM(AGGR(DISTINCT...Long formula ... , Dimension)
here is the full formula
sum({<KGS={">100000000"}>}CAPEX_OHNE_TRASSEN)+
SUM({<KGS={">100000000"}>}
AGGR(DISTINCT
(
if(TRASSEN_TYP='LEERROHR' and sum(HK_ROUTINGS)>'0',COST_HK_LEERROHR_M,0)
+ if(sum(HK_ROUTINGS)>0,COST_HK_M,0)
+ if(TRASSEN_TYP='TIEFBAU' and ASB_CLUSTER='1' and sum(HK_ROUTINGS)>0,COST_HK_TIEFBAU_DENSE_URBAN_M,0)
+ if(TRASSEN_TYP='TIEFBAU' and ASB_CLUSTER='2' and sum(HK_ROUTINGS)>0,COST_HK_TIEFBAU_URBAN_M,0)
+ if(TRASSEN_TYP='TIEFBAU' and ASB_CLUSTER='3' and sum(HK_ROUTINGS)>0,COST_HK_TIEFBAU_RURAL_M,0)
+ if(sum(VZK_ROUTINGS)>0 and (TRASSEN_TYP='LEERROHR' or sum(HK_ROUTINGS)>0),COST_VZK_LT_LEERROHR_M,0)
+ if (sum(VZK_ROUTINGS)>0 and ASB_CLUSTER=1 and sum(HK_ROUTINGS)=0 and TRASSEN_TYP='TIEFBAU',COST_VZK_LT_TIEFBAU_DENSE_URBAN_M,0)
+ if (sum(VZK_ROUTINGS)>0 and ASB_CLUSTER=2 and sum(HK_ROUTINGS)=0 and TRASSEN_TYP='TIEFBAU',COST_VZK_LT_TIEFBAU_URBAN_M,0)
+ if (sum(VZK_ROUTINGS)>0 and ASB_CLUSTER=3 and sum(HK_ROUTINGS)=0 and TRASSEN_TYP='TIEFBAU',COST_VZK_LT_TIEFBAU_RURAL_M,0)
)
*only(LENGTH_M)
,MP_DB_TRASSEN_ID)
)
To follow up the idea to replace the if-statements by flags, I changed the whole formula and replaced the "type" checks by flags and the ">=" or "=0" conditions by some x/x calculations. Unfortunately the result seems to contain too many individual calculations and thus the calculation time is even 25% longer.