Unlock a world of possibilities! Login now and discover the exclusive benefits awaiting you.
- Qlik Community
- :
- All Forums
- :
- QlikView App Dev
- :
- practising QV
- Subscribe to RSS Feed
- Mark Topic as New
- Mark Topic as Read
- Float this Topic for Current User
- Bookmark
- Subscribe
- Mute
- Printer Friendly Page
- Mark as New
- Bookmark
- Subscribe
- Mute
- Subscribe to RSS Feed
- Permalink
- Report Inappropriate Content
practising QV
Hi All,
I have to merge 2 bar chart into one.
here I attached QVW, it contains Old status & New Status in 2 seperate bar charts. I need it in one chart which needs to show Old & New chart side by side.
Thanks..
Accepted Solutions
- Mark as New
- Bookmark
- Subscribe
- Mute
- Subscribe to RSS Feed
- Permalink
- Report Inappropriate Content
Hi,
one possible solution could be:
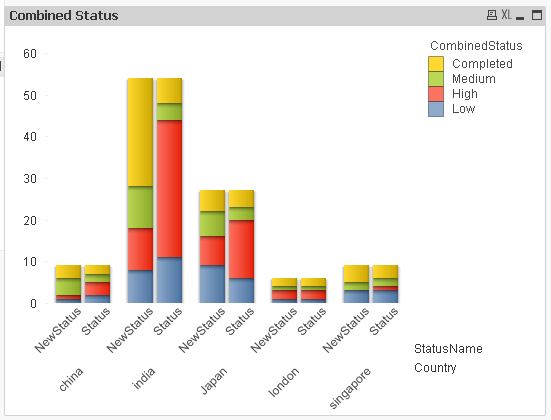
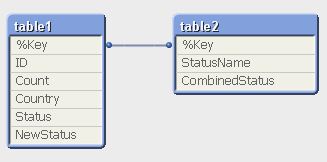
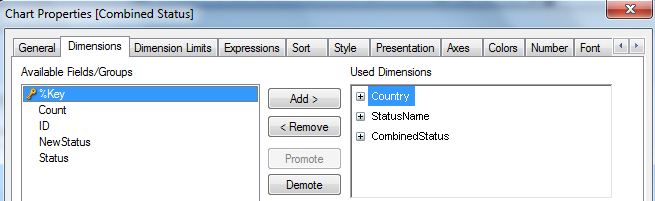
table1:
LOAD *,
     AutoNumberHash128(ID,Count,Country) as %Key;
LOAD ID,
     Count,
     Country,
     Status,
     NewStatus
FROM
[Status report.xlsx]
(ooxml, embedded labels, table is Sheet1);

table2:
CrossTable (StatusName, CombinedStatus)
LOAD %Key,
     Status,
     NewStatus
Resident table1;
hope this helps
regards
Marco
- Mark as New
- Bookmark
- Subscribe
- Mute
- Subscribe to RSS Feed
- Permalink
- Report Inappropriate Content
Hi,
one possible solution could be:
table1:
LOAD *,
     AutoNumberHash128(ID,Count,Country) as %Key;
LOAD ID,
     Count,
     Country,
     Status,
     NewStatus
FROM
[Status report.xlsx]
(ooxml, embedded labels, table is Sheet1);

table2:
CrossTable (StatusName, CombinedStatus)
LOAD %Key,
     Status,
     NewStatus
Resident table1;
hope this helps
regards
Marco
- Mark as New
- Bookmark
- Subscribe
- Mute
- Subscribe to RSS Feed
- Permalink
- Report Inappropriate Content
Hi Marco,
Thanks for your help. Can you please tell me what is the purpose of "AutoNumberHash128" & "CrossTable " ?
- Mark as New
- Bookmark
- Subscribe
- Mute
- Subscribe to RSS Feed
- Permalink
- Report Inappropriate Content
Hi,
I wanted to create an additional dimension StatusName and a combined status field.
Instead of integrating it into your table, I chose to create a seperate table which had to be linked to the corresponding rows. (Integrating in the table would have duplicated the rows -> possible count issues)
To create a key field, I used the Autonumberhash128 function, which creates a unique key value per distinct combination of the ID, count and country fields.
The Crosstable load created the additional table with status and Newstatus in seperate rows instead of seperate fields/columns.
hope this helps
regards
Marco
- Mark as New
- Bookmark
- Subscribe
- Mute
- Subscribe to RSS Feed
- Permalink
- Report Inappropriate Content
Hi Marco,
Bit confusing, but I will try to understand. Thanks for your help.