Unlock a world of possibilities! Login now and discover the exclusive benefits awaiting you.
Announcements
FLASH SALE: Save $500! Use code FLASH2026 at checkout until Feb 14th at 11:59PM ET. Register Now!
- Qlik Community
- :
- All Forums
- :
- QlikView App Dev
- :
- qlikview-bubble chart
Options
- Subscribe to RSS Feed
- Mark Topic as New
- Mark Topic as Read
- Float this Topic for Current User
- Bookmark
- Subscribe
- Mute
- Printer Friendly Page
Turn on suggestions
Auto-suggest helps you quickly narrow down your search results by suggesting possible matches as you type.
Showing results for
Partner - Contributor III
2016-07-13
10:07 AM
- Mark as New
- Bookmark
- Subscribe
- Mute
- Subscribe to RSS Feed
- Permalink
- Report Inappropriate Content
qlikview-bubble chart
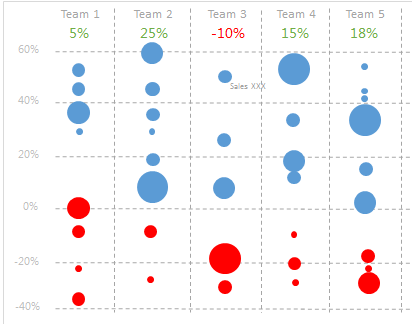
Hello,guys,I wanna create bubble chart with qlikview,just like screenshot,the KPI is income vs. with last year and the bubbles are people,
axes Y is income vs. with last year. I don,t know how to do it, is there anybody could offer some ideas? Thanks so much.
513 Views
1 Reply
Partner - Contributor III
2016-07-13
10:20 AM
Author
- Mark as New
- Bookmark
- Subscribe
- Mute
- Subscribe to RSS Feed
- Permalink
- Report Inappropriate Content
I wanna show personnel distribution for each team,thanks
434 Views