Unlock a world of possibilities! Login now and discover the exclusive benefits awaiting you.
- Qlik Community
- :
- All Forums
- :
- QlikView App Dev
- :
- Re: reference line
- Subscribe to RSS Feed
- Mark Topic as New
- Mark Topic as Read
- Float this Topic for Current User
- Bookmark
- Subscribe
- Mute
- Printer Friendly Page
- Mark as New
- Bookmark
- Subscribe
- Mute
- Subscribe to RSS Feed
- Permalink
- Report Inappropriate Content
reference line
Hello there,
Looking to add a reference line to a horizontal bar chart. Normally this is pretty easy using the presentation tab, reference line, but my dimension causes some issues.
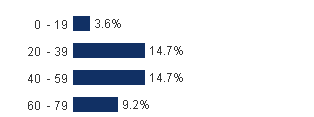
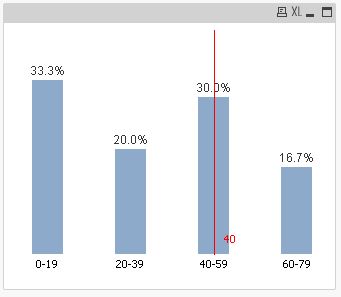
My dimension is a field where the values are a range, '0-19', '20-39', etc. I want to assign a reference line at a particular point, say 40.
- « Previous Replies
-
- 1
- 2
- Next Replies »
- Mark as New
- Bookmark
- Subscribe
- Mute
- Subscribe to RSS Feed
- Permalink
- Report Inappropriate Content
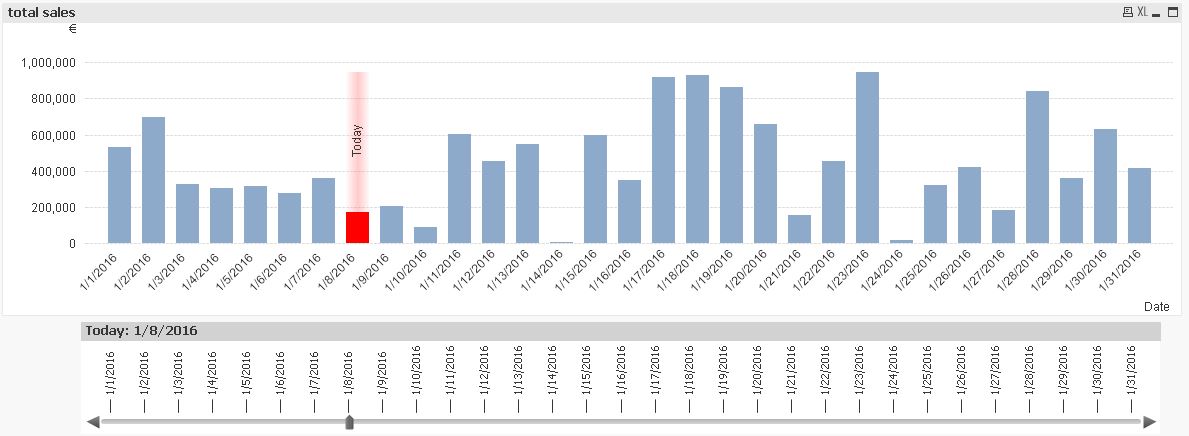
May be this chart helps you
I draw at the selected bar one background bar. - it`s not reference line on selected dimension, but maybe it helps you.
I had investigate a lot of resources, but i haven`t found anything with reference line as on the Chart Example.png.
May be extensions such Google Charts has such functionality, because QlikView as I see allow this only for continuous dimension.
- Mark as New
- Bookmark
- Subscribe
- Mute
- Subscribe to RSS Feed
- Permalink
- Report Inappropriate Content
- Mark as New
- Bookmark
- Subscribe
- Mute
- Subscribe to RSS Feed
- Permalink
- Report Inappropriate Content
Marco,
This is an interesting approach, but I dont think it will work in this case.
This solution requires the x-axis to be marked as continuous and if I do that, I lose the true value of the field (as it changes to a number).
0-19 becomes 0
20-39 becomes 20
...
Since there is no number option for string, I am not sure how to get the true labels back.
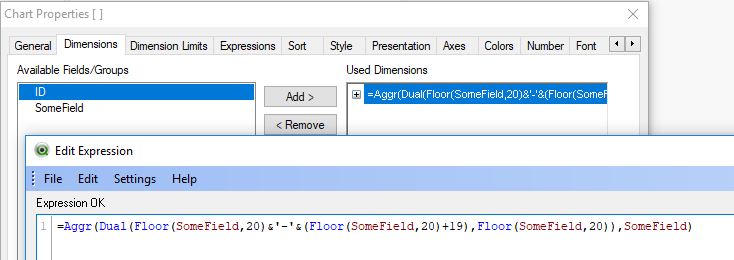
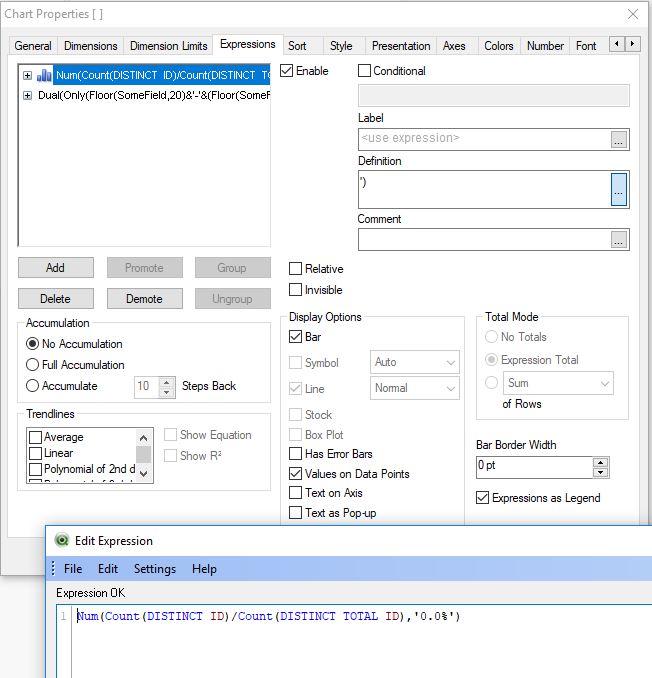
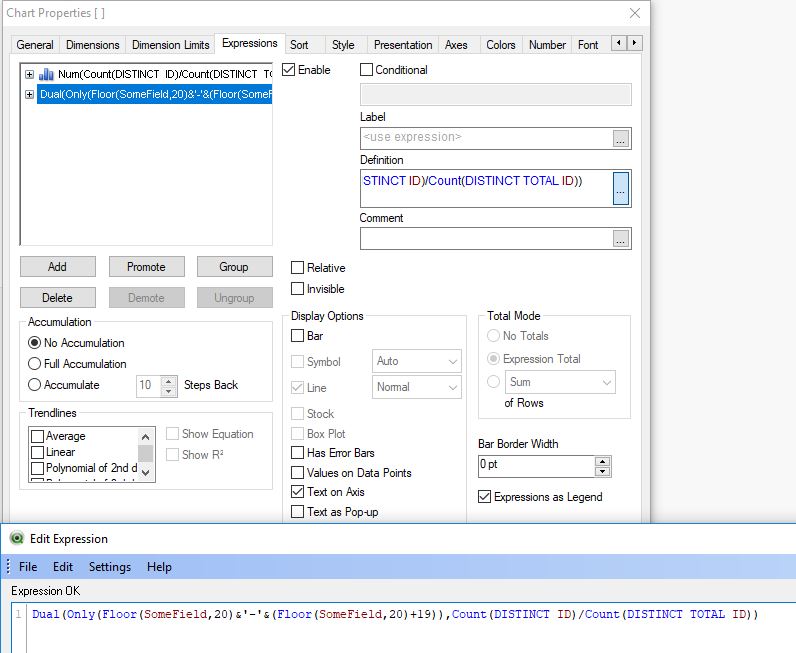
This did get me thinking though. I wonder if I could create this field as a dual so that the range is the string, and assign a value to the second part). Doing that might just allow for a continuous axis.
- Mark as New
- Bookmark
- Subscribe
- Mute
- Subscribe to RSS Feed
- Permalink
- Report Inappropriate Content
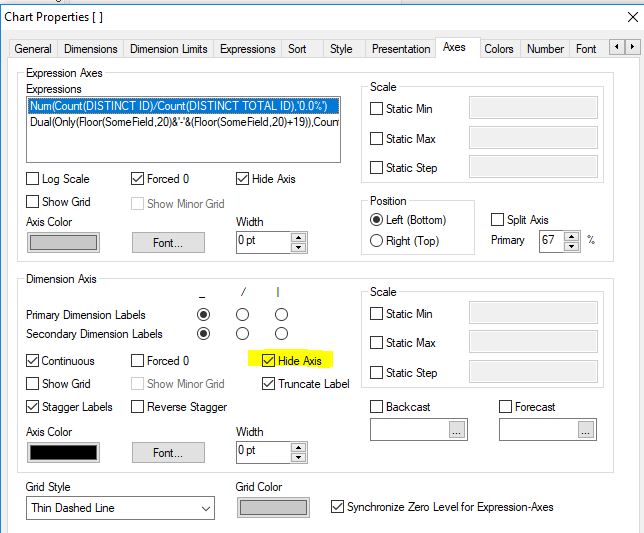
I'm not quite sure whether a continuous valued reference line in between discrete bars makes much sense but one way to do so might be:
hope this helps
regards
Marco
- Mark as New
- Bookmark
- Subscribe
- Mute
- Subscribe to RSS Feed
- Permalink
- Report Inappropriate Content
Marco,
Thank you for putting together this example and taking the time to outline the steps. I apologize for not getting back to you sooner but I just had the chance to review this.
I cant seem to make this work for me.
My dimension is a field, Patient_MME_Bucket. It is based on the actually score in Patient_MME_Score, but it already represents the bucket, i.e. "0-19", or "30-49".
One potential problem is that my numbers get quite large, 1000's. Not sure if that is the reason, but my bars dont actually line up with the new labels.
- Mark as New
- Bookmark
- Subscribe
- Mute
- Subscribe to RSS Feed
- Permalink
- Report Inappropriate Content
Hi,
can you create a small set of sample data (incl. your Patient_MME_Bucket field) and your required result based on this data to get a better impression?
thanks
regards
Marco
- « Previous Replies
-
- 1
- 2
- Next Replies »