Unlock a world of possibilities! Login now and discover the exclusive benefits awaiting you.
- Qlik Community
- :
- All Forums
- :
- QlikView App Dev
- :
- restricting data points to the terminal peek
- Subscribe to RSS Feed
- Mark Topic as New
- Mark Topic as Read
- Float this Topic for Current User
- Bookmark
- Subscribe
- Mute
- Printer Friendly Page
- Mark as New
- Bookmark
- Subscribe
- Mute
- Subscribe to RSS Feed
- Permalink
- Report Inappropriate Content
restricting data points to the terminal peek
Hi,
I have a requirement wherein I would want to show trend using the line chart which would display seperation wise sales within limited space but when I shrink the size of the chart the data points appearing on it look messy.Thus I would want diaplay data points only at the begining and at the end of the chart.I have attached the application so please have a look onto it and let me know how it could be done any other suggestions on this issue which suits the requirement would also be helpful
- Tags:
- new_to_qlikview
- « Previous Replies
-
- 1
- 2
- Next Replies »
- Mark as New
- Bookmark
- Subscribe
- Mute
- Subscribe to RSS Feed
- Permalink
- Report Inappropriate Content
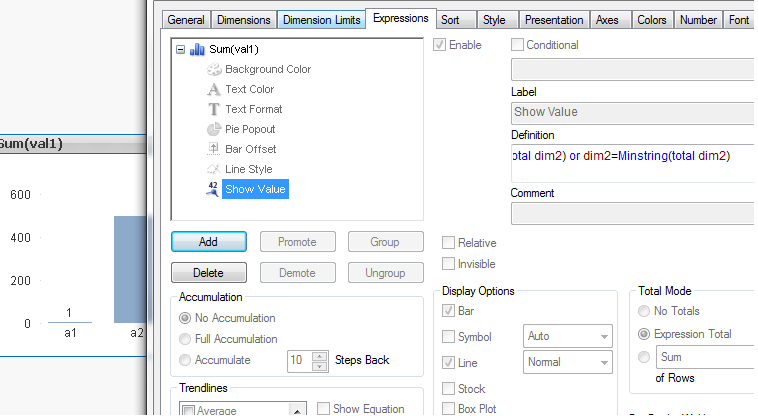
Possibly you want something like attached sample. The same you can do with your application dynamically using Date() function or MonthName() function yo generate your YearMonth field with a proper date representation rather that a text (like you did).
The value on data points can be conditionally displayed using expression's Show Value feature.
- Mark as New
- Bookmark
- Subscribe
- Mute
- Subscribe to RSS Feed
- Permalink
- Report Inappropriate Content
Hi,
I did try the approach that is been suggested but could not get the desired results, this could be because I am not handling the date properly.
Below is the piece of code that I tried.
Year_Month=MinString(Year_Month) or Year_Month=MaxString(Year_Month)
//Year=min(Year) and My_Month=min(My_Month)
//or (Year=max(Year) and My_Month=max(My_Month))
I am also attaching the file.Please let me know how it could be manipulated to achieve the same.
Thanks & Regards,
Anushree Shetty
- Mark as New
- Bookmark
- Subscribe
- Mute
- Subscribe to RSS Feed
- Permalink
- Report Inappropriate Content
While loading, try:
Date(MakeDate(Year, My_Month), 'YYYY-MMM') as YearMonth
or
MonthName(MakeDate(Year, My_Month)) as YearMonth
instead of Year & '-' & My_Month as Year_Month
Edit:
Sorry, MakeDate() would not work diectly in your case as the My_Month field is not numeric. Try like:
Date(MakeDate(Year,Num( Month(Date#(My_Month,'MMM')))), 'YYYY-MMM') as YearMonth
If you face issues, please share your sample excel file.
- Mark as New
- Bookmark
- Subscribe
- Mute
- Subscribe to RSS Feed
- Permalink
- Report Inappropriate Content
Its not working, I am attaching the excel that I have used
Thanks & Regards,
Anushree Shetty
- Mark as New
- Bookmark
- Subscribe
- Mute
- Subscribe to RSS Feed
- Permalink
- Report Inappropriate Content
Dear Anushree Shetty,
I Created one field in the backend
Year&''&MonthNumbers as Year_MonthNumbers
I use the applymap to bring the MonthNumbers into Exisiting table.
it is working fine.
Kindly find the attachment.
i hope it will help you.
- Mark as New
- Bookmark
- Subscribe
- Mute
- Subscribe to RSS Feed
- Permalink
- Report Inappropriate Content
PFA
- Mark as New
- Bookmark
- Subscribe
- Mute
- Subscribe to RSS Feed
- Permalink
- Report Inappropriate Content
Thank you so much tresesco, Could you please explain the use of total keyword in the show value expression.I am unable to understand why the value does not get displayed if total is not used
Thanks & Regards,
Anushree Shetty
- Mark as New
- Bookmark
- Subscribe
- Mute
- Subscribe to RSS Feed
- Permalink
- Report Inappropriate Content
TOTAL is used to ignore dimension. That means if you don't use total keyword, then Max() would calculate the same value for each row, because the scope of max is the row itself. If you want to find the max of all the members of dimension values, then TOTAL has to be used to define the broader scoe for max().
Hope this gives you some idea.
- Mark as New
- Bookmark
- Subscribe
- Mute
- Subscribe to RSS Feed
- Permalink
- Report Inappropriate Content
Hi Tresesco,
Thank you so much for the explanation
I want to know if the chart can be made to show the data points only for lowest value and the highest value as well
For eg in the application we are displaying the count so is it possible to display the data points for lowest and the highest count in the chart.
Thanks & Regards,
Anushree Shetty
- « Previous Replies
-
- 1
- 2
- Next Replies »