Unlock a world of possibilities! Login now and discover the exclusive benefits awaiting you.
- Qlik Community
- :
- All Forums
- :
- QlikView App Dev
- :
- scatter chart problem
- Subscribe to RSS Feed
- Mark Topic as New
- Mark Topic as Read
- Float this Topic for Current User
- Bookmark
- Subscribe
- Mute
- Printer Friendly Page
- Mark as New
- Bookmark
- Subscribe
- Mute
- Subscribe to RSS Feed
- Permalink
- Report Inappropriate Content
scatter chart problem
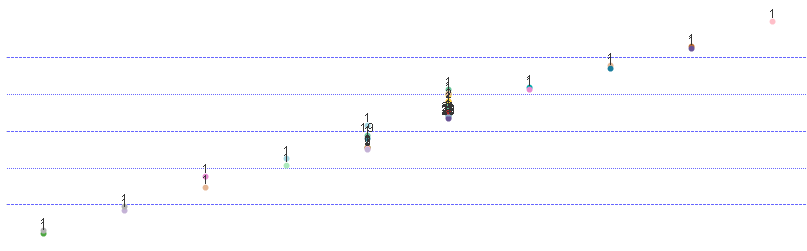
The 1st picture is my scatter chart and the 2nd is wat the result i need. so i want to ask hw can i add the line into my scatter chart? the line mayb depand on average or correralation line also can.
-----------------------------------------------------------------------------------------------------------------------------------------------------------------------
.png)
- Tags:
- new_to_qlikview
- Mark as New
- Bookmark
- Subscribe
- Mute
- Subscribe to RSS Feed
- Permalink
- Report Inappropriate Content
Goto the presentation tab, add reference lines.
- Mark as New
- Bookmark
- Subscribe
- Mute
- Subscribe to RSS Feed
- Permalink
- Report Inappropriate Content
jz simply go to the presentation tab and add a reference lines only? need any setting? i'm a newbie of QV, please hlp me. Thank~
- Mark as New
- Bookmark
- Subscribe
- Mute
- Subscribe to RSS Feed
- Permalink
- Report Inappropriate Content
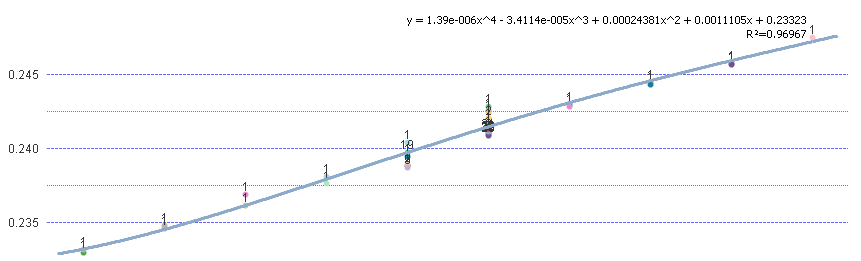
this is wat after i added the trendlines. May i ask what is the trendlines stand for?
- Mark as New
- Bookmark
- Subscribe
- Mute
- Subscribe to RSS Feed
- Permalink
- Report Inappropriate Content
trendlines are usually used to show an average and you could see how your values fare against the average.
- Mark as New
- Bookmark
- Subscribe
- Mute
- Subscribe to RSS Feed
- Permalink
- Report Inappropriate Content
for my job i need to add 1 line which is like the trendlines but i need to used my own formula so that the line can do the calculation based on my formula. i want to ask QV is able to do this job or not?