Unlock a world of possibilities! Login now and discover the exclusive benefits awaiting you.
- Qlik Community
- :
- All Forums
- :
- QlikView App Dev
- :
- select cell in pivot table and filter in order to ...
- Subscribe to RSS Feed
- Mark Topic as New
- Mark Topic as Read
- Float this Topic for Current User
- Bookmark
- Subscribe
- Mute
- Printer Friendly Page
- Mark as New
- Bookmark
- Subscribe
- Mute
- Subscribe to RSS Feed
- Permalink
- Report Inappropriate Content
select cell in pivot table and filter in order to that cell
Hi
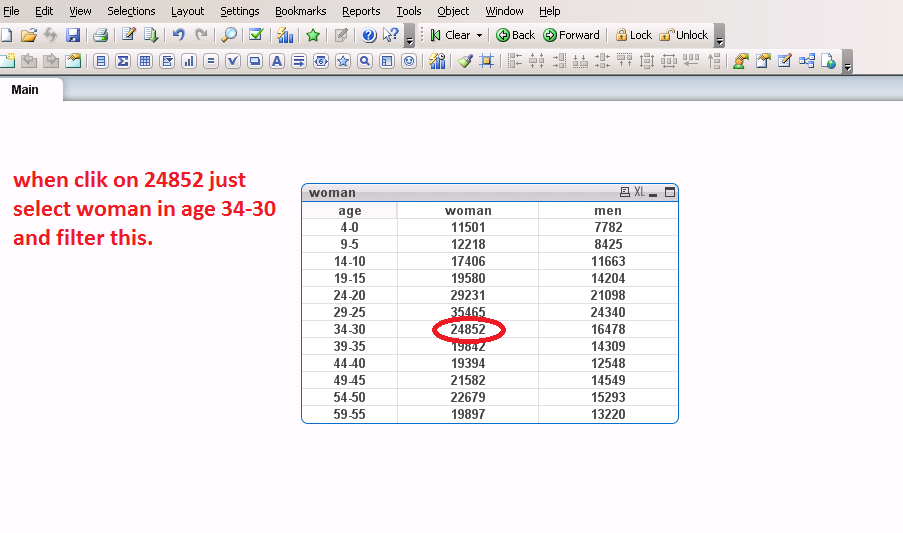
I have a important question. in pivot table that have a lot of dimension and expression how we can select a cell and filter in order to that special dimension and expression. like the sample in the image!
- Mark as New
- Bookmark
- Subscribe
- Mute
- Subscribe to RSS Feed
- Permalink
- Report Inappropriate Content
If you clicked on any cell the dimensions behind these cell will be selected but you couldn't select expressions. This meant if age-group and gender are dimensions you would select those dimension-values by clicking - do you use instead two expressions to differentiate the gender you will by clicking only select the age-group.
- Marcus
- Mark as New
- Bookmark
- Subscribe
- Mute
- Subscribe to RSS Feed
- Permalink
- Report Inappropriate Content
As marcus said in the above post if the dimension is related to each other i.e the if that ID you select belong to 1 particular age group the data would be automatically filtered .
- Mark as New
- Bookmark
- Subscribe
- Mute
- Subscribe to RSS Feed
- Permalink
- Report Inappropriate Content
I know we can select dimension but I wanted to select expression too 
- Mark as New
- Bookmark
- Subscribe
- Mute
- Subscribe to RSS Feed
- Permalink
- Report Inappropriate Content
It's not possible to select dimensions through expressions within a chart - there is no connection between the expression-label and the used dimensions and conditions within the expression (probably something like: {< GenderFlag = {1}>} which are only a filtering on the possible dataset which is then aggregated in some way.
The only way to get near to your idea is the use of calculated dimensions within the chart or maybe within a listbox but this method has limitations regarding to the usability and it could slow down the performance. Very often it's useful to transfer these things into the script to handle then with real dimensions.
- Marcus