Unlock a world of possibilities! Login now and discover the exclusive benefits awaiting you.
- Qlik Community
- :
- All Forums
- :
- QlikView App Dev
- :
- set analysis/filter problem
- Subscribe to RSS Feed
- Mark Topic as New
- Mark Topic as Read
- Float this Topic for Current User
- Bookmark
- Subscribe
- Mute
- Printer Friendly Page
- Mark as New
- Bookmark
- Subscribe
- Mute
- Subscribe to RSS Feed
- Permalink
- Report Inappropriate Content
set analysis/filter problem
Hi
"=avg( total <[Stock no]> {<[Lead time (days)]={"">=$(=fractile(total<[Stock no]> [Lead time (days)],$(Percentile_Min))) <=$(=fractile(total<[Stock no]> [Lead time (days)],$(Percentile_Max)) )""}>}
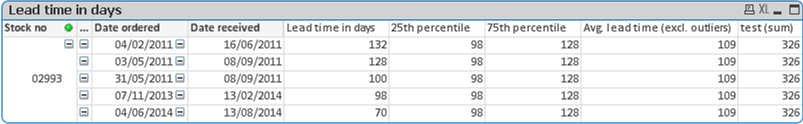
When the model is filtered to a specific stock no the table below shows the expected (CORRECT) results. On this occasion 98 is the 25th percentile and 128 is the | |||||||||||||||||||||||||||||||||||||||||||||||||||||||||
| 75th percentile and the expression is averaging 98, 100 and 128 as they fall within the criteria. The values 132 and 70 are excluded which is what I want. | |||||||||||||||||||||||||||||||||||||||||||||||||||||||||
 | |||||||||||||||||||||||||||||||||||||||||||||||||||||||||
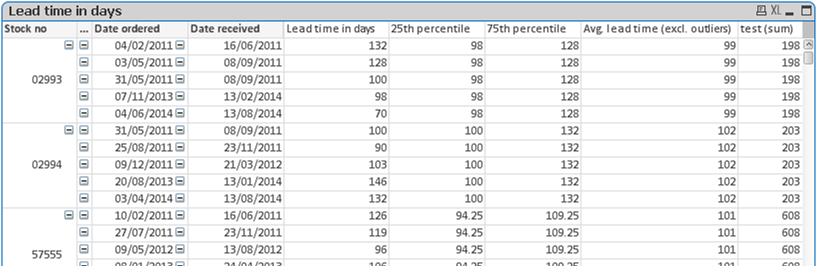
| However, when the model is unfiltered and although the percentile values remain unchanged, the expression seems to interpret the lead time values differently | |||||||||||||||||||||||||||||||||||||||||||||||||||||||||
| and as a result, it is excluding the 128 lead time. It is only averaging the 98 and 100 returning a result of 99…? | |||||||||||||||||||||||||||||||||||||||||||||||||||||||||
 | |||||||||||||||||||||||||||||||||||||||||||||||||||||||||
| Can anyone tell me why and better still suggest a solution? | |||||||||||||||||||||||||||||||||||||||||||||||||||||||||
| Many thanks |
Oli
- Mark as New
- Bookmark
- Subscribe
- Mute
- Subscribe to RSS Feed
- Permalink
- Report Inappropriate Content
I am not an expert, so experts, correct me if I am wrong, but set analysis take a single value for the chart and hence when you have not selected on stock no, it may be calculating a Fractile number based on all the stock no. I would have asked you to use aggr, but it doesn't work within set analysis because of the same reason that set analysis takes a single value for a chart. The only solution I can think of is to calculate 25th and 75th Fractile in the script using group by statement and then use that in your chart.
Hope that helps.
Best,
S
- Mark as New
- Bookmark
- Subscribe
- Mute
- Subscribe to RSS Feed
- Permalink
- Report Inappropriate Content
Thanks for the reply
Sadly I can not get this to work in the script. So I am not sure if there is a solution for my problem??
Oli
- Mark as New
- Bookmark
- Subscribe
- Mute
- Subscribe to RSS Feed
- Permalink
- Report Inappropriate Content
You don't have access to the script or you are not sure how to do this within the script? If you can share some dummy data, I may be able to help you.
Best,
S
- Mark as New
- Bookmark
- Subscribe
- Mute
- Subscribe to RSS Feed
- Permalink
- Report Inappropriate Content
I have access to the script but I am not sure I can load an example easily due to the models size and complexity. I will see what I can come up with.
Thanks again.
- Mark as New
- Bookmark
- Subscribe
- Mute
- Subscribe to RSS Feed
- Permalink
- Report Inappropriate Content
Not a problem. Hope you are able to achieve what you are trying to do.
Best,
S