Unlock a world of possibilities! Login now and discover the exclusive benefits awaiting you.
Announcements
FLASH SALE: Save $500! Use code FLASH2026 at checkout until Feb 14th at 11:59PM ET. Register Now!
- Qlik Community
- :
- All Forums
- :
- QlikView App Dev
- :
- set analysis help
Options
- Subscribe to RSS Feed
- Mark Topic as New
- Mark Topic as Read
- Float this Topic for Current User
- Bookmark
- Subscribe
- Mute
- Printer Friendly Page
Turn on suggestions
Auto-suggest helps you quickly narrow down your search results by suggesting possible matches as you type.
Showing results for
Not applicable
2014-09-04
05:58 PM
- Mark as New
- Bookmark
- Subscribe
- Mute
- Subscribe to RSS Feed
- Permalink
- Report Inappropriate Content
set analysis help
This is what my table looks like currently....what set analysis can I use to make them be side by side?
| yr/wk | product | region | sales | forecast |
|---|---|---|---|---|
| 201236 | a | west | 175 | |
| 201237 | b | east | 500 | |
| 201336 | a | west | 200 | |
| 201337 | b | east | 400 | |
| 201436 | a | west | 194 | |
| 201437 | b | east | 345 |
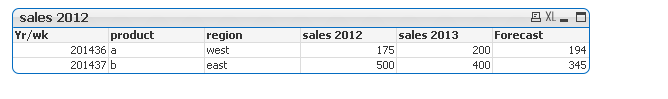
I would like for them to look like this
| yr/wk | product | region | sales 2 yr previously (2012 sales) | sales 1 year previously (2013 sales) | forecast |
|---|---|---|---|---|---|
| 201436 | a | west | 175 | 200 | 194 |
| 201437 | b | east | 500 | 400 | 345 |
251 Views
1 Reply
Not applicable
2014-09-04
06:43 PM
Author
- Mark as New
- Bookmark
- Subscribe
- Mute
- Subscribe to RSS Feed
- Permalink
- Report Inappropriate Content
Attached is the QVW document with the table u asked for. There is a back end script change involved in it. Hope this helps.
184 Views