Unlock a world of possibilities! Login now and discover the exclusive benefits awaiting you.
- Qlik Community
- :
- All Forums
- :
- QlikView App Dev
- :
- unit price aggregation calculation
- Subscribe to RSS Feed
- Mark Topic as New
- Mark Topic as Read
- Float this Topic for Current User
- Bookmark
- Subscribe
- Mute
- Printer Friendly Page
- Mark as New
- Bookmark
- Subscribe
- Mute
- Subscribe to RSS Feed
- Permalink
- Report Inappropriate Content
unit price aggregation calculation
I’m stuck on an aggregation calculation.
I’ve to calculate a price variation value by day and display it by month (in sheets, graphics…).
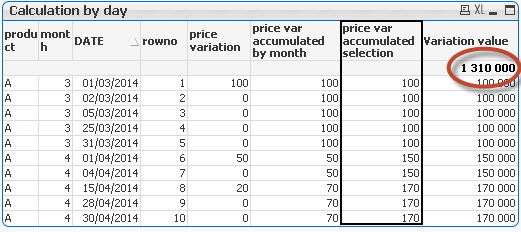
In the following table, the last column is correct and display the good result in the circle.
It works as I’ve used the following formula in the accumulated selection column:
rangesum(above(total sum(variation), 0, rowno(Total)))
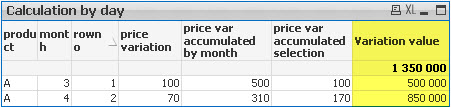
How could I get the same result if I remove the DATE dimension or if I want it in a text box ?
Incorrect value in the yellow outlined column after DATE dimension removing (as the calculation should be based on dates):
I’ve tried some calculations in text boxes but I can’t get the correct result. ie:
=sum(AGGR(sum(aggr(sum({<DATE={"<=$(=max(DATE))"}>}variation),DATE))*qty,DATE))
If someone has a good idea… it would be nice
Find the qvw attached
Thanks
- Tags:
- aggr
- aggregation
- price
Accepted Solutions
- Mark as New
- Bookmark
- Subscribe
- Mute
- Subscribe to RSS Feed
- Permalink
- Report Inappropriate Content
Try this in your text box expression:
=sum(aggr( sum(qty)*rangesum(above(variation,0,rowno())) ,DATE))
- Mark as New
- Bookmark
- Subscribe
- Mute
- Subscribe to RSS Feed
- Permalink
- Report Inappropriate Content
Try this in your text box expression:
=sum(aggr( sum(qty)*rangesum(above(variation,0,rowno())) ,DATE))
- Mark as New
- Bookmark
- Subscribe
- Mute
- Subscribe to RSS Feed
- Permalink
- Report Inappropriate Content
I didn't know you could that kind of expression in a text box (or elsewhere)
It works perfectly
thanks !!