Unlock a world of possibilities! Login now and discover the exclusive benefits awaiting you.
- Qlik Community
- :
- All Forums
- :
- QlikView App Dev
- :
- user defined function issue
- Subscribe to RSS Feed
- Mark Topic as New
- Mark Topic as Read
- Float this Topic for Current User
- Bookmark
- Subscribe
- Mute
- Printer Friendly Page
- Mark as New
- Bookmark
- Subscribe
- Mute
- Subscribe to RSS Feed
- Permalink
- Report Inappropriate Content
user defined function issue
Hey all,
first off all I am quite new to the QlikView Community and still only have a basic knowledge in the use of QlikView. I am reading temperature and humidity data from a database. I can show all the values in diagramms and so on, no problem. But now I want to create a user defined function to calculate the total amount of water in the air. Therefore I have a formular:
0.622 * (rel. hum * saturated vapour pressure) / (air pressure - rel. hum * saturated vapour pressure)
To test the function I use a fix value for saturated vapour pressure at 20°C = 2337
I built following function in QlikView:
0.622 & '*' & (Only({$} $1) & '*' & 2337) & '/' & (101300 & '-' & Only({$} $1) & '*' & 2337)
Now I want to use this function in a diagramm, so that for every value of a dimension the function Only() picks its value. But it doesn't work  How can i fix this? I would be very happy about any help! Thanks a lot.
BR
Henrik
Accepted Solutions
- Mark as New
- Bookmark
- Subscribe
- Mute
- Subscribe to RSS Feed
- Permalink
- Report Inappropriate Content
IN LOAD SCRIPT WRITE:
SET YourFomulaName= Num(0.622 * ( $1 * $2 ) / (($3- $1) * $2));
Let's say your dimension's name is RELHUM
then in the expression
=$(YourFormulaName(RELHUM,2337,101300))
Note: no need for {$} as it implies the current selection by default.
check this thread
- Mark as New
- Bookmark
- Subscribe
- Mute
- Subscribe to RSS Feed
- Permalink
- Report Inappropriate Content
please post sample data/app
- Mark as New
- Bookmark
- Subscribe
- Mute
- Subscribe to RSS Feed
- Permalink
- Report Inappropriate Content
How and where do you call your user-defined function?
- Mark as New
- Bookmark
- Subscribe
- Mute
- Subscribe to RSS Feed
- Permalink
- Report Inappropriate Content
Only(fieldname) will return a value if the field has just one selected value. If the field has more than one value selected then only(fieldname) will return null.
Thus your expression will return null unless every field value is filtered to only select a single value - not what you want.
You should be able to use a similar expression to
0.622 * (rel. hum * saturated vapour pressure) / (air pressure - rel. hum * saturated vapour pressure)
directly in the chart.
Simply substitute each item such as "rel. hum", "saturated vapour pressure" etc, with the field names that hold the data.
You do not need to create a user defined function, just create an expression in your chart.
Can you post some example data?
- Mark as New
- Bookmark
- Subscribe
- Mute
- Subscribe to RSS Feed
- Permalink
- Report Inappropriate Content
Hi,
one possible solution could be:
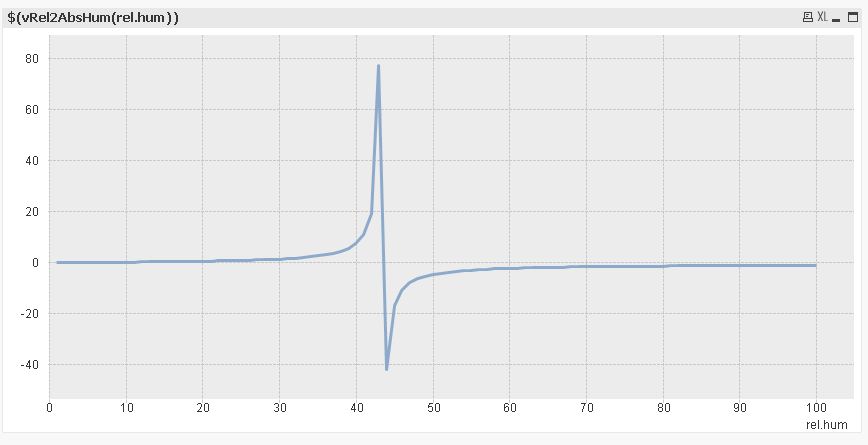
SET vRel2AbsHum = 0.622*$1*2337/(101300-$1*2337);

tabHumidity:
LOAD Dual(RecNo()&' RH%', RecNo()) as rel.hum
AutoGenerate 100;
hope this helps
regards
Marco
- Mark as New
- Bookmark
- Subscribe
- Mute
- Subscribe to RSS Feed
- Permalink
- Report Inappropriate Content
it's an expression that takes parameters and parameters are identified by their position using $1, $2 etc.
check Marco reply.
Jagan uses it in this thread.
- Mark as New
- Bookmark
- Subscribe
- Mute
- Subscribe to RSS Feed
- Permalink
- Report Inappropriate Content
IN LOAD SCRIPT WRITE:
SET YourFomulaName= Num(0.622 * ( $1 * $2 ) / (($3- $1) * $2));
Let's say your dimension's name is RELHUM
then in the expression
=$(YourFormulaName(RELHUM,2337,101300))
Note: no need for {$} as it implies the current selection by default.
check this thread
- Mark as New
- Bookmark
- Subscribe
- Mute
- Subscribe to RSS Feed
- Permalink
- Report Inappropriate Content
Try chaining it:
saturated vapour pressure
=$(YourFormulaName(RELHUM,=$(VapPress(Temp)),101300))
- Mark as New
- Bookmark
- Subscribe
- Mute
- Subscribe to RSS Feed
- Permalink
- Report Inappropriate Content
Hey,
first of all I would like to thank you for all the responses. I reviewd the different methods to achieve my goal. Finally I used this function and it worked as I wanted:
SET udf_water_content = Num(0.622*($1*$2)/(($3-$1*$2)));
But now I sure want to get the saturated vapour pressure of the measured temperature.
water_content = $(udf_water_content(humidity,=$(VapPress(=$(round(temperature))),101300));
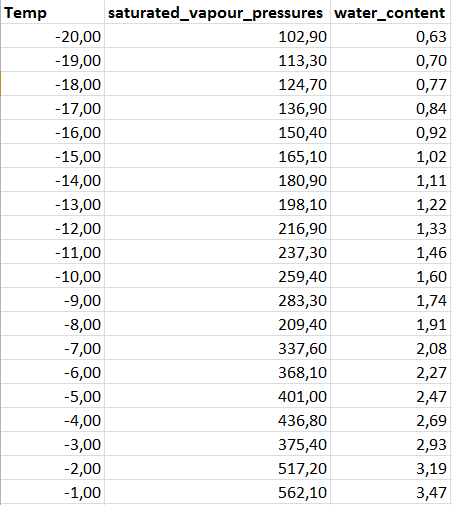
I have a table with temperatures from -20 to 99 °C with the associated saturated vapour pressures. So how can I define the VapPress function to select the vapour pressure of the associated temperature? Attached you can see the table with the preassures. And not to forget: The meassured temperatures are floats, so I would need ro round them.
Thanks for all following replys.
BR
Henrik
- Mark as New
- Bookmark
- Subscribe
- Mute
- Subscribe to RSS Feed
- Permalink
- Report Inappropriate Content
Hi,
please close this thread by selecting an answer that solved your problem and open another thread for your new question.
Thanks
Regards
Marco