Unlock a world of possibilities! Login now and discover the exclusive benefits awaiting you.
- Qlik Community
- :
- All Forums
- :
- QlikView App Dev
- :
- using month-year as dimension need to show previou...
- Subscribe to RSS Feed
- Mark Topic as New
- Mark Topic as Read
- Float this Topic for Current User
- Bookmark
- Subscribe
- Mute
- Printer Friendly Page
- Mark as New
- Bookmark
- Subscribe
- Mute
- Subscribe to RSS Feed
- Permalink
- Report Inappropriate Content
using month-year as dimension need to show previous 3 months data excluding current month
hello,
I have requirement to show previous 3 months data excluding current month in table chart month-year as dimension.
i am using below set expression
=Sum({1<DATE={">=$(=MonthStart(AddMonths(Max(DATE),-3)))<=$(=MonthEnd(AddMonths(Max(DATE),-1)))"}>}[SUBS_GROSS_ADD])
it is working for text object respective of selection.but in table chart i have four aggregation fields based on moth-year dimension and only for one aggregation i have to show previous 3 months excluding current month so i am using above set expression for that but it is not working.it is giving month wise aggregation instead of previous 3 months results.how can i achieve this in table chart with dimension.
please help on same.
Thanks in advance.
Accepted Solutions
- Mark as New
- Bookmark
- Subscribe
- Mute
- Subscribe to RSS Feed
- Permalink
- Report Inappropriate Content
can you share a sample app?
is the time one of the dimensions in your table chart?
- Mark as New
- Bookmark
- Subscribe
- Mute
- Subscribe to RSS Feed
- Permalink
- Report Inappropriate Content
can you share a sample app?
is the time one of the dimensions in your table chart?
- Mark as New
- Bookmark
- Subscribe
- Mute
- Subscribe to RSS Feed
- Permalink
- Report Inappropriate Content
yes,Month_Year is dimension for table chart
can't share sample app that is huge file i can attach screenshot for your information
please help on same
what ever marked for that iam applying set expression as mentioned above discussion.
Thanks in advance
regards
kavitha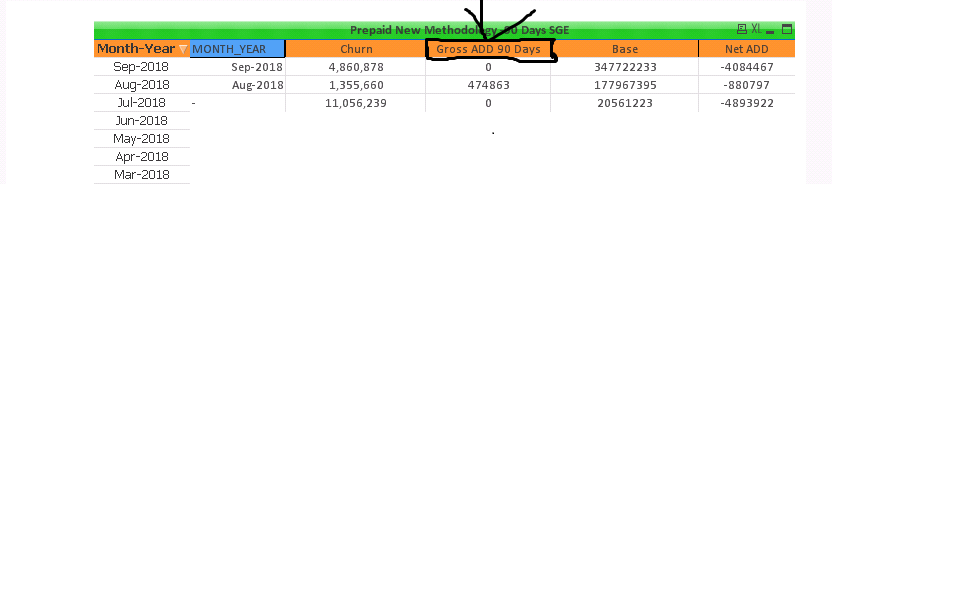
- Mark as New
- Bookmark
- Subscribe
- Mute
- Subscribe to RSS Feed
- Permalink
- Report Inappropriate Content
since month year is a dimension set analysis wont work i think.
you can possibly use above function or an as of table (see below link)
Calculating rolling n-period totals, averages or other aggregations