Unlock a world of possibilities! Login now and discover the exclusive benefits awaiting you.
- Qlik Community
- :
- All Forums
- :
- QlikView App Dev
- :
- very very important....how to add a row in pivot t...
- Subscribe to RSS Feed
- Mark Topic as New
- Mark Topic as Read
- Float this Topic for Current User
- Bookmark
- Subscribe
- Mute
- Printer Friendly Page
- Mark as New
- Bookmark
- Subscribe
- Mute
- Subscribe to RSS Feed
- Permalink
- Report Inappropriate Content
very very important....how to add a row in pivot table
hi
i am creating a pivot table in which i am taking a column from database as row. from database i am getting six different rows but i want to add 2 more rows showing the total of these 8 rows and their count.
how can i do that.....plz help me
- « Previous Replies
- Next Replies »
- Mark as New
- Bookmark
- Subscribe
- Mute
- Subscribe to RSS Feed
- Permalink
- Report Inappropriate Content
Hi Michael,
i am facing another challenge with your solution.
Now i am developing monthly reports,in monthly reports i am transposing a dimension to make it column headers in the pivot table.
but in it ia ma not getting total top 50,
the expression which i am using is aggr(if(rank(sum(membercnt),4)<51,id),id)----calculated dimension
in the the expression, if(rowno()>0,sum({<trend={'i'}>}amonut),sum(if(aggr(rank(sum(membercnt),4),id)<51,aggr(sum({<trend={'i'}>}amonut),id))))
but not getting the the sum of top 50,its showing 0 value.
the dimension which has been transposed is made from months name.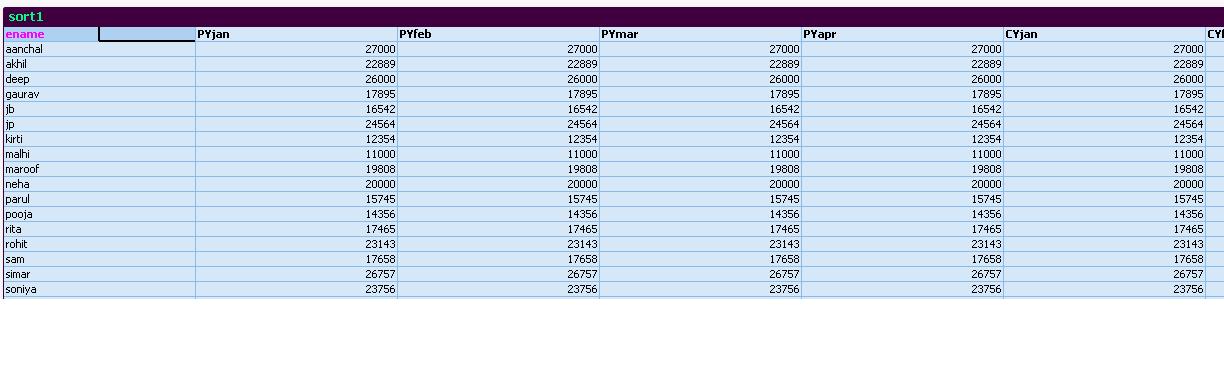
- Mark as New
- Bookmark
- Subscribe
- Mute
- Subscribe to RSS Feed
- Permalink
- Report Inappropriate Content
Vitul,
Unfortunately I don't have time for more or less involved questions. I recommend you to hire a QV consultant to help with development. Or, for the beginning, try to start a new thread here at Community - most people do not read threads with multiple replies, but almost everyone reads the new questions.
Regards,
Michael
PS: After transposing, the condition rowno() is probably not usable for your purpose.
- « Previous Replies
- Next Replies »