Unlock a world of possibilities! Login now and discover the exclusive benefits awaiting you.
Announcements
April 13–15 - Dare to Unleash a New Professional You at Qlik Connect 2026: Register Now!
- Qlik Community
- :
- All Forums
- :
- QlikView App Dev
- :
- visualization challenges while creating straight t...
Options
- Subscribe to RSS Feed
- Mark Topic as New
- Mark Topic as Read
- Float this Topic for Current User
- Bookmark
- Subscribe
- Mute
- Printer Friendly Page
Turn on suggestions
Auto-suggest helps you quickly narrow down your search results by suggesting possible matches as you type.
Showing results for
Contributor
2016-03-30
04:16 AM
- Mark as New
- Bookmark
- Subscribe
- Mute
- Subscribe to RSS Feed
- Permalink
- Report Inappropriate Content
visualization challenges while creating straight table
HI,
I one of the requirement , we have to create our KPI report Sae like Excel base report .
Screenshot given below:
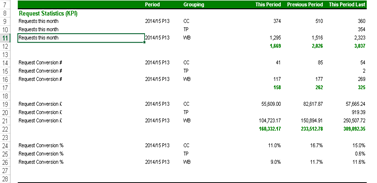
But the issue is each KPI is different rom other Like Request This Month ,Request Conversion Etc.
Please suggest how can I build this scenario in qlikview straight table......
606 Views
1 Reply
Anonymous
Not applicable
2016-03-30
08:15 AM
- Mark as New
- Bookmark
- Subscribe
- Mute
- Subscribe to RSS Feed
- Permalink
- Report Inappropriate Content
Hi, I am not able to understand what do you want..if possible please share the sample data and screen shot also because screen shot that you have provided not visible properly...
please explain bit more about your problem..
542 Views