Unlock a world of possibilities! Login now and discover the exclusive benefits awaiting you.
- Qlik Community
- :
- Forums
- :
- Analytics & AI
- :
- QlikView
- :
- Documents
- :
- How to Create a Profit and Loss Statement in QlikV...
- Subscribe to RSS Feed
- Mark as New
- Mark as Read
- Bookmark
- Subscribe
- Printer Friendly Page
- Report Inappropriate Content
How to Create a Profit and Loss Statement in QlikView
- Mark as New
- Bookmark
- Subscribe
- Mute
- Subscribe to RSS Feed
- Permalink
- Report Inappropriate Content
How to Create a Profit and Loss Statement in QlikView
Aug 10, 2012 9:56:45 AM
Aug 10, 2012 9:56:45 AM
Have you ever created a P&L statement in QlikView? Well, this technical brief outlines how to create a P&L statement in QlikView 11 using IntervalMatch.
Also check out this blog post.
Thanks,
Jennell
- Mark as Read
- Mark as New
- Bookmark
- Permalink
- Report Inappropriate Content
Wow, Jennell. Thanks so much for responding to my question so quickly!
Unfortunately I have all of those elements set up already. Seems that because the value in P&L Heading is the same for these rows in the table it's always going to group them in my chart. I guess I don't really understand how having the 's' and the blank result for the expression stops the dimension from grouping together?
I took your sample qvw and added another chart following the instructions and the blank row shows up perfectly! Then I created a new chart in my qvw following the exact same steps and same problem; no blank rows! I also recreated my spreadsheet just to be sure and no luck.
Then I created a new qvw with just the P&L stuff in and still no luck. 😞
You've been so generous with your time and advice already but if you had any other tips they would be greatly appreciated.
Thanks,
Lorna
- Mark as Read
- Mark as New
- Bookmark
- Permalink
- Report Inappropriate Content
Okay, figured it out upon closer examination of Jennell's spreadsheet. In addition to the level column having an 's', in the Exec P&L Heading column each of those 's' rows had a unique number of spaces. I updated my spreadsheet to increase the number of spaces by 1 for each of my s rows and voila!
Thanks Jennell. Works like a charm.
Lorna
- Mark as Read
- Mark as New
- Bookmark
- Permalink
- Report Inappropriate Content
Hi Jennell,
Enjoying very much reading your post and trying to get my head around your solution but for some reason when I download the Technical Brief, I get a message saying unable to open the zip file. Could I please ask you to check it as I would really like to learn more.
Many Thanks, Neil.
- Mark as Read
- Mark as New
- Bookmark
- Permalink
- Report Inappropriate Content
Wish I had seen this post. I just spent about 45 mins and finally noticed the spaces in the ExecProfitLoss.xls "Exec P&*L Heading" column on the 's' rows. Oh well, glad I figured it out though. Jennell this is an AWESOME example thanks very much for taking the time to post it! (could you add a comment to step 5 in the Word doc mentioning the required spaces in the xls?) Thanks again.
- Mark as Read
- Mark as New
- Bookmark
- Permalink
- Report Inappropriate Content
Hi,
I have the same issue (% of sales or gross margin as %). any feedback?
Thanks
LC
- Mark as Read
- Mark as New
- Bookmark
- Permalink
- Report Inappropriate Content
You could simplify the variance column by using the expression "Column(1)/Column(2) - 1". Of course you will need to be aware that if the column positions change the formula will be incorrect.
- Mark as Read
- Mark as New
- Bookmark
- Permalink
- Report Inappropriate Content
Hi Richard,
Good suggestion - I have updated the "Technical Brief - How to Create a Profit and Loss Statement in QlikView" Word Document to include a note about the spaces.
Thanks,
Jennell
- Mark as Read
- Mark as New
- Bookmark
- Permalink
- Report Inappropriate Content
Hi Jennell
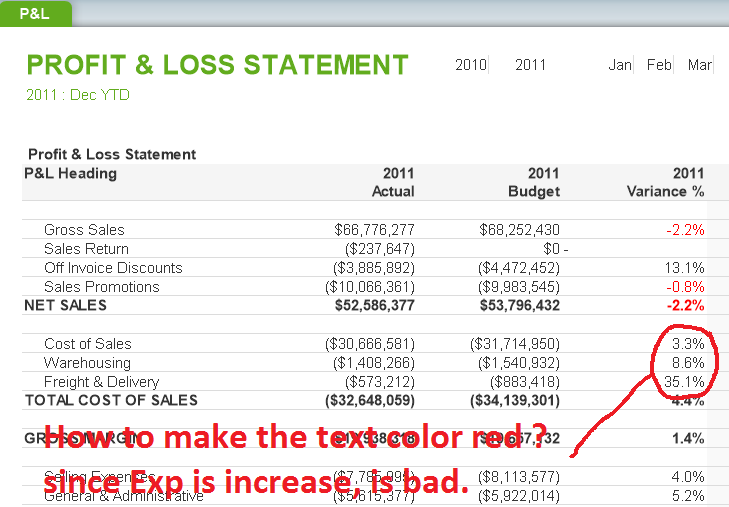
I like to know are you able to make the variance % col for those -ve value like Expense items if increase , meaning is no good , and variance % text color change to red ?
So i can focus on those red color text.
Paul
- Mark as Read
- Mark as New
- Bookmark
- Permalink
- Report Inappropriate Content
Hi Paul,
In order to show positive values in red, you will need to modify the expression in the Text Color property of the expression as seen below.
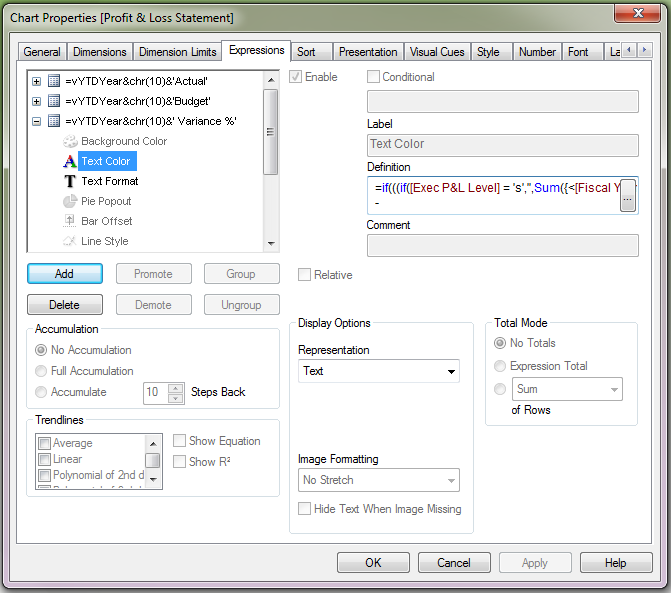
Original Expression:
=if(((if([Exec P&L Level] = 's','',Sum({<[Fiscal Year]={$(vYTDYear)} >} [Amount]))
-
if([Exec P&L Level] = 's','',Sum({<[Fiscal Year]={$(vYTDYear)} >} [Budget Amount])))
/
fabs(if([Exec P&L Level] = 's','',Sum({<[Fiscal Year]={$(vYTDYear)} >} [Budget Amount]))))
<=0, LightRed())
Change To:
=if(((if([Exec P&L Level] = 's','',Sum({<[Fiscal Year]={$(vYTDYear)} >} [Amount]))
-
if([Exec P&L Level] = 's','',Sum({<[Fiscal Year]={$(vYTDYear)} >} [Budget Amount])))
/
fabs(if([Exec P&L Level] = 's','',Sum({<[Fiscal Year]={$(vYTDYear)} >} [Budget Amount]))))
>0, LightRed())
Hope this helps.
Jennell
- Mark as Read
- Mark as New
- Bookmark
- Permalink
- Report Inappropriate Content
Hi Jenell
Thank you vey much for your reply.
Your new expression work for COGS when COGS is increase. But now Sales does not working. because when sales is drop i need it display as Red.
In other word, i wanted only text display Red when the row have problem. May i know it there any alternative ? So that user can focus only row which display red.
Paul