Unlock a world of possibilities! Login now and discover the exclusive benefits awaiting you.
Recent Documents
-
QlikView App: Set Analysis - Prior Period Comparison
This QlikView shows how basic Set Analysis syntax can be used to deliver a Prior Period Comparison. Rather than taking the approach of flagging rows a... Show MoreThis QlikView shows how basic Set Analysis syntax can be used to deliver a Prior Period Comparison.
Rather than taking the approach of flagging rows as being in certain periods at load time this example shows the comparisons based on selections. It is an approach I have used many times on client site and tends to offer the users what they require.
The QlikView was originally written as a response to the following QlikCommunity thread: http://community.qlik.com/message/102230
If you want to copy and paste the table from this example into another document you can set all the variables by adding this code to your load script:
let vMaxDate = '=max(Date)';
let vMaxDay = '=day(max(Date))';
let vMaxMonth = '=month(max(Date))';
let vMaxYear = '=max(Year)';
let vPriorMonth = '=month(addmonths(max(Date),-1))';
let vPriorMonthYear = '=Year(addmonths(max(Date),-1))';
let vPriorYear = '=vMaxYear-1';
let vPriorYearDate = '=date(addyears(max(Date),-1),' & chr(39) & 'DD MMM YYYY' & chr(39) & ')';
Obviously you will need to change the field names to match the date fields in your data model.
There is a Qlik Sense version of this application available for download here:
Qlik Sense App: Prior Period Comparison with Set Analysis
There are a number of other tutorials and downloadable examples on our website here:
https://www.quickintelligence.co.uk/qlikview-examples/
If you have any questions please post them in the comments below.
Steve Dark
-
Set Analysis - Análisis de conjuntos (en Español)
There are many documents and notes which talk about Set Analysis, but until the moment I started to write this manual I didn´t find any in Spanish, so... Show MoreThere are many documents and notes which talk about Set Analysis, but until the moment I started to write this manual I didn´t find any in Spanish, so I decided to write it.
Most of it is based on translated adaptations of previous works that I found in the community, to which I have added my own examples that I have been finding over the years. On the last page you will find the references.
This is a first version that will improve with your comments, corrections and contributions.
I hope you find it useful.-----------------------------------------------------------------------------------------------------------------------------------------------------------------------------
Son muchos los documentos y notas que hablan de los análisis de conjuntos (Set Analysis), pero hasta el momento de comenzar a redactar este manual no encontré ninguno en Español, así que me decidí a escribirlo.
La mayor parte está basado en adaptaciones traducidas de trabajos previos que encontré en la community, a los que he añadido ejemplos de cosecha propia que me he ido encontrando a lo largo de los años. En la última página encontraréis las referencias.
Esta es una primera versión que iré mejorando con vuestros comentarios, correcciones y aportaciones.
Espero que os sea de utilidad.
------------------------------------------------------------------------------------------------------------------------------------------------------------------------------
Special thanks to Henric Cronstöm who encouraged me to write it when I was part of the spanish Qlik consulting team.
-
Set Analysis for certain Point in Time
Hi All,Sometimes there may be requirements from users where they want to see the charts in from certain point of time like YTD, QTD, MTD, Last 5 Years... Show MoreHi All,
Sometimes there may be requirements from users where they want to see the charts in from certain point of time like YTD, QTD, MTD, Last 5 Years etc., please find the set analysis expressions for this type of scenarios.
YTD Sales (Year To Date)
Sum({<Year=, Quarter=, Month=, Week=, Date={‘>=$(=YearStart(Today()))<=$(=Today())’}>} Sales )
Note: Year=, Quarter=, Month=, Week= excludes the selections in Year, Quarter, Month and Week dimensions.
QTD Sales (Quarter To Date)
Sum({<Year=, Quarter=, Month=, Week=, Date={‘>=$(=QuarterStart(Today()))<=$(=Today())’}>} Sales)
MTD Sales (Month To Date)
Sum({<Year=, Quarter=, Month=, Week=, Date={‘>=$(=MonthStart(Today()))<=$(=Today())’}>} Sales)
WTD Sales (Week To Date)
Sum({<Year=, Quarter=, Month=, Week=, Date={‘>=$(=WeekStart(Today()))<=$(=Today())’}>} Sales)
Last 5 Years Sales
Sum({<Year=, Quarter=, Month=, Week=, Date={‘>=$(=YearStart(Today(), -4))<=$(=Today())’}>} Sales )
Last 6 Quarters Sales
Sum({<Year=, Quarter=, Month=, Week=, Date={‘>=$(=QuarterStart(Today(), -5))<=$(=Today())’}>} Sales )
Last 12 Months Sales
Sum({<Year=, Quarter=, Month=, Week=, Date={‘>=$(=MonthStart(Today(), -11))<=$(=Today())’}>} Sales )
Last 15 Weeks Sales
Sum({<Year=, Quarter=, Month=, Week=, Date={‘>=$(=WeekStart(Today(), -14))<=$(=Today())’}>} Sales )
Last 10 Days Sales
Sum({<Year=, Quarter=, Month=, Week=, Date={‘>=$(=Date(Today()-9))<=$(=Today())’}>} Sales )
Yesterday Sales
Sum({<Year=, Quarter=, Month=, Week=, Date={‘$(=Date(Today()-1))’}>} Sales )
You can also arrive some flags for above scenarios in script and you use those flags in Set Analysis expression if your data always based on Current Date. Refer below link created by Richard.Pearce60
Calendar with flags making set analysis so very simple
Hope this helps.
Regards,
Jagan.
-
YTQ, QTD, MTD and WTD
Year, Quarter, Month and Week To Date are the common analysis that I seen many applications. I will share the expression to do hereFirst to do this yo... Show MoreYear, Quarter, Month and Week To Date are the common analysis that I seen many applications. I will share the expression to do here
First to do this your data model should have the DateField in number format by applying floor
Similar to this
Floor(DateField) AS DateNum //it will gives you one whole number to represent date
YTD - Year To Date
A date should be selected and it will look for the Starting date of the year to the selected date.
Ex: date selected is 21-03-2014 then YTD is 01-01-2014 to 21-03-2014
Expression would be
Sum({<Year=, Month=, Quarter=, Week=, DateField=, DateNum={">=$(=Num(YearStart(Max(DateNum))))<=$(=Max(DateNum))"}>} Sales)
QTD- Quarter to Date
In the place of year use Quarter
Sum({<Year=, Month=, Quarter=, Week=, DateField=, DateNum={">=$(=Num(QuarterStart(Max(DateNum))))<=$(=Max(DateNum))"}>} Sales)
MTD- Month to Date
Sum({<Year=, Month=, Quarter=, Week=, DateField=, DateNum={">=$(=Num(MonthStart(Max(DateNum))))<=$(=Max(DateNum))"}>} Sales)
WTD- Week to Date
Sum({<Year=, Month=, Quarter=, Week=, DateField=, DateNum={">=$(=Num(WeekStart(Max(DateNum))))<=$(=Max(DateNum))"}>} Sales)
if you want you can set a variable value as 'Year', 'Month', 'Quarter', 'Week', lets say vToDate and go with single chart and single expression
Sum({<Year=, Month=, Quarter=, Week=, DateField=, DateNum={">=$(=Num($(=vToDate& 'Start(Max(DateNum))')))<=$(=Max(DateNum))"}>} Sales)
Will keep your expression simple
Regards,
Celambarasan
-
Transformación de fechas en QV
Ejemplos de Función Date# y Date para transformar fechas y luego darles formato. Esto como método alternativo a MakeDate, que usa 4 funciones haciendo... Show MoreEjemplos de Función Date# y Date para transformar fechas y luego darles formato. Esto como método alternativo a MakeDate, que usa 4 funciones haciendo más lento el load:
MakeDate(Left(20130628,4), Mid(20130628,5,2),Right(20130628,2))
1. Date#(20130628,'YYYYMMDD')
Devuelve 41453 en formato 20130628
2. Date(Date#(20130628,'YYYYMMDD'),'DD-MMM-YY')
Devuelve 41453 con formato 28-jun-13
3. Date(Date#('2013.06.28','YYYY.MM.DD'),'DD-MMM-YY')
Devuelve 41453 con formato 28-jun-13
4. Date(Date#('06-28-13','MM-DD-YY'),'DD-MMM-YY')
Devuelve 41453 con formato 28-jun-13
5. Date(Date#('28.06.13' ,'DD.MM.YY'),'DD-MMM-YY')
Devuelve 41453 con formato 28-jun-13
6. Date(Date#('jun.28.2011', 'DD.MMM.YYYY'), 'DD-MMM-YY')
Devuelve 41453 con formato 28-jun-13
7. Para eliminar hora de una fecha
Date(Floor( '2013-06-28 07:30:38' ),'DD-MMM-YY')
Devuelve 41453 con formato 28-jun-13 sin minutos
8. Para obtener solo la hora de una fecha
Time(Frac( '2013-06-28 11:30:38' ),'hh:mm:ss')
Devuelve 0,47960648148 con formato 11:30:38
9. Para obtener Fecha y Hora
Date( Timestamp#( '20130628 11:30:38', 'YYYYMMDD hh:mm:ss'), 'DD-MMM-YY hh:mm:ss' )
Devuelve 41453,479606481 con formato 28-jun-13 11:30:38
10. Para obtener día de la semana en fecha
Date( '2013-06-28', 'WWW DD-MMM-YY')
Devuelve 41453 con formato vie 28-jun-13
11. Resta un mes a la fecha
AddMonths('2013-06-28',-1)
Devuelve 41422 en formato 28/05/2013 (formato predeterminado)
12. Suma un mes a la fecha
AddMonths('2013-06-28', 1)
Devuelve 41453 en formato 28/07/2013 (formato predeterminado)
Esta nota esta publicada en el blog: Qlikview en Español
NOTAS:
Al indicar un formato de hora en Qlikview la letra mayuscula M= mes, y letra minuscula m= minutos
Referencias (ingles)
http://community.qlik.com/blogs/qlikviewdesignblog/2013/02/19/why-don-t-my-dates-work
-
Linking to two or more dates
This tutorial presents a script pattern for assigning time dimensions to multiple fact dates in a data model. It answers the commonly asked Forum ques... Show MoreThis tutorial presents a script pattern for assigning time dimensions to multiple fact dates in a data model. It answers the commonly asked Forum question "how do I link to two dates"?
The pattern will demonstrate how to link all fact dates to a common calendar as well as using separate calendars for each fact date.
-
Power Tools 1.3.2 for QlikView
Power Tools for QlikView Version: 1.3.2 ..again! A small update of one tool, and test of another. Download here https://www.dropbox.com/sh/8hac72al... Show MorePower Tools for QlikView
Version: 1.3.2

..again! A small update of one tool, and test of another.
Download here
https://www.dropbox.com/sh/8hac72aljgqlr7d/AAASkzbM2H1OoVcLE_wa0kWGa?dl=0
 For the absolute latest version, please see Power Tools for QlikView - One-stop-shop
QlikView 12.X support matrix
12.0 12.1 12.2 QlikView Server Agent Yes Yes Yes QlikView Server Super Agent Yes Yes Yes QMSClient Yes Yes Yes Qv User Manager 10 Qv User Manager 11 QvsDetector Yes Yes Yes QvServerObjectConnector ReloadScheduleMigration No No No ServerObjectHandler Yes Yes Yes ServerObjectHandlerBatch Yes Yes Yes SharedFileRepair SharedFileViewer XMLDBViewer Yes Yes Yes Reviewed/updated with support for QlikView 12
- QlikView Server Agent *tested* - 1.6.2 - supported
- QlikView Server Super Agent *updated*- 1.7.3 - supported
Release notes here: Power Tools 1.3.2 for QlikView - Release Notes
Readme here: Power Tools 1.3.2 for QlikView - Readme
Want to collaborate?Do you have questions, thoughts, suggestions or bugs to report on Power Tools? Please post in the forums on QlikCommunity: https://community.qlik.com/community/qlikview/management
Also check out our (currently dead, soon to be revived) Twitter: @QvPowerTools
DISCLAIMER
Power Tools are a collection of software programs and tools used for troubleshooting purposes only. Power Tools are provided free of charge and are not supported. Power Tools are not official QlikView products and are provided without warranty. Use of Power Tools is entirely at the user's own risk.
-
QlikView 12 Application: System Monitor
A derivative of the QlikView System Monitor for versions 10/11, finally the QlikView 12-compatible version has arrived. The UI has undergone some chan... Show MoreA derivative of the QlikView System Monitor for versions 10/11, finally the QlikView 12-compatible version has arrived. The UI has undergone some changes and the structure/setup has been simplified. This application will read your QVS machine logs and output all kinds of information for you, such as virtual memory warnings, PGO/.Shared errors, user trending and utilization, and chronological logging events across the system.
If you're looking for the QV 11.2 version, please find it here.
Thanks for your patience and if you have any questions/comments please post to this thread!
Best,
MT !
-
Working Hours Calculation excluding weekends and holidays
Calculating working hours is an essential measure in many business scenarios. In this post, I will demonstrate the steps to calculate this measure. Ad... Show MoreCalculating working hours is an essential measure in many business scenarios. In this post, I will demonstrate the steps to calculate this measure. Additionally, I will cover other aspects related to working hours, such as calculating overtime and excluding lunch breaks.
Note:
The example in this post assumes weekends are Saturday and Sunday. If your weekends fall on different days, please refer to the post linked below.
Working-days-and-hours-calculations-for-custom-weekends
Consider the following case:
Suppose a ticket is logged into the system on a certain day, referred to as the Start Date, and the same ticket is resolved on a different day, referred to as the End Date. We may want to calculate the working hours between these two dates to assess the efficiency of ticket closure time.
Here is how you can calculate it within the script
1) Calculate business working hours excluding week ends(Saturday and Sunday) and Holidays.
Following are the considerations
1) Count only standard working hours ( 9 AM - 6 PM) - You can change accordingly
2) Exclude Saturdays and Sundays
3) Exclude Holidays
You can adjust the date format of the variables below according to actual format in your data. Then use timestamp() function to represent it in required format.
SET TimeFormat='hh:mm:ss';
SET DateFormat='DD/MM/YYYY';SET TimestampFormat='DD/MM/YYYY hh:mm:ss';
Set up the variables below for standard working hours on weekdays. You can adjust the variables according to your working hours (e.g., 9 AM - 6 PM), and the rest of the calculations will be done automatically.
// Set the start and end hour of the day in 24 hour format
LET vStartHour = 9;
LET vEndHour = 18;
LET vWorkingHourPerDay = $(vEndHour) -$(vStartHour);
Set up the holiday list as shown below. Feel free to use your own holiday list.
Holidays:
LOAD Concat(chr(39)&Holidays&chr(39),',') as Holidays Inline [
Holidays
08/03/2016
09/03/2016
17/08/2010
];

LET vHolidays = Peek('Holidays',0,'Holidays');
Following is the logic to calculate the business working hours between to dates
Data:
LOAD *,
           rangesum(
           NetWorkDays(START_TIME+1,END_TIME-1,$(vHolidays)) * MakeTime($(vWorkingHourPerDay)), // In between hours
           if(NetWorkDays(END_TIME,END_TIME,$(vHolidays)),
           Rangemin(rangemax(frac(END_TIME),maketime($(vStartHour))),maketime($(vEndHour)))-
           Rangemax(rangemin(frac(END_TIME),maketime($(vStartHour))),maketime($(vStartHour))),0), // working hours last day
           if(NetWorkDays(START_TIME,START_TIME,$(vHolidays)),
           Rangemin(rangemax(frac(START_TIME),maketime($(vEndHour))),maketime($(vEndHour)))-
           Rangemax(rangemin(frac(START_TIME),maketime($(vEndHour))),maketime($(vStartHour))),0), // working hours first day
           if(NetWorkDays(START_TIME,START_TIME,$(vHolidays)) and floor(START_TIME)=floor(END_TIME),-MakeTime($(vWorkingHourPerDay))) // If same day  then correct the hours
           )*24 AS Business_Hrs_Without_Overtime,

          rangesum(if(NetWorkDays(START_TIME,START_TIME,$(vHolidays)) ,
          rangesum(if(frac(START_TIME)<maketime($(vStartHour)),maketime($(vStartHour))-frac(START_TIME),0),
          if(frac(END_TIME)>maketime($(vEndHour)),frac(END_TIME)-maketime($(vEndHour)),0))*24)) as Overtime ; // Overtime

LOAD *,
           timestamp(StartTime,'DD/MM/YYYY hh:mm:ss TT') as START_TIME,
           timestamp(EndTime,'DD/MM/YYYY hh:mm:ss TT') as END_TIME
Inline [
TicketNo,StartTime, EndTime
1, 8/25/2010 3:00:00 PM, 8/27/2010 6:00:00 PM
2, 8/16/2010 10:00:00 AM, 8/17/2010 1:00:00 PM
3, 8/17/2010 1:30:00 PM, 8/17/2010 2:45:00 PM
4, 8/17/2010 3:00:00 PM, 8/18/2010 5:00:00 PM
5, 8/18/2010 5:01:00 PM, 8/19/2010 4:00:00 PM
6, 8/19/2010 5:00:00 PM, 8/20/2010 10:00:00 AM
7, 8/20/2010 11:00:00 AM, 8/20/2010 5:00:00 PM
8, 8/23/2010 2:00:00 PM, 8/23/2010 4:00:00 PM
9, 8/23/2010 5:00:00 PM, 8/23/2010 6:00:00 PM
10, 8/24/2010 7:00:00 AM, 8/24/2010 2:00:00 PM
11, 8/20/2010 5:30:00 PM,8/23/2010 1:00:00 PM
12, 3/7/2016 4:00:00 PM, 3/10/2016 6:00:00 PM
13, 8/19/2010 11:00:00 AM, 8/20/2010 6:30:00 PM];

DROP Fields StartTime, EndTime;
You can then create measures to display working hours. Use the measure below if you want to present the working hours in hh:mm:ss format.
=interval(sum(Business_Hrs_Without_Overtime)/24,'hh:mm:ss')
2) Calculate business working hours excluding week ends(Saturday and Sunday), Lunch Breaks and Holidays.
Below are the considerations
1) Count only standard working hours ( 9 AM - 6 PM)
2) Exclude Saturdays and Sundays
3) Exclude Lunch Break (1 PM - 2PM)
4) Exclude Holidays
Set the Variables for standard working hours and lunch breaks. You can change the values according to your needs
// Set the start and end hour of the day in 24 hour format
LET vStartHour = 9;
LET vEndHour = 18;
LET vLunchStart =13;
LET vLunchEnd =14;
LET vWorkingHourPerDay = ($(vEndHour) -$(vStartHour))-($(vLunchEnd)-$(vLunchStart));
Include the Holidays
// Include the holidays list
Holidays:
LOAD Concat(chr(39)&Holidays&chr(39),',') as Holidays Inline [
Holidays
08/03/2016
09/03/2016
 ];

LET vHolidays = Peek('Holidays',0,'Holidays');
Following is the logic to calculate the business working hours between two dates
Data:
LOAD *,
             rangesum(
             NetWorkDays(START_TIME+1,END_TIME-1,$(vHolidays)) * MakeTime($(vWorkingHourPerDay)), // 12 hours per workday, for all day inbetween the period, excluding bounderies
             if(NetWorkDays(END_TIME,END_TIME,$(vHolidays)) ,
             rangesum(rangemin(frac(END_TIME),MakeTime($(vLunchStart)))- rangemin(frac(END_TIME),MakeTime($(vStartHour))) ,
             rangemin(frac(END_TIME),MakeTime($(vEndHour))) - rangemin(frac(END_TIME),MakeTime($(vLunchEnd)))),0), // working hours last day
             if(NetWorkDays(START_TIME,START_TIME,$(vHolidays)),
             rangesum(MakeTime($(vLunchStart)) - rangemin(rangemax(frac(START_TIME), MakeTime($(vStartHour))),MakeTime($(vLunchStart))),
             MakeTime($(vEndHour)) - rangemax(rangemin(frac(START_TIME), MakeTime($(vEndHour))),MakeTime($(vLunchEnd)))),0), // working first day
             if(NetWorkDays(START_TIME,START_TIME,$(vHolidays)) and floor(START_TIME)=floor(END_TIME),-MakeTime($(vWorkingHourPerDay))) // If the same day then correct the hours
             )*24 AS Business_Hrs_Without_Overtime,

             rangesum(if(NetWorkDays(START_TIME,START_TIME,$(vHolidays)) ,
             rangesum(if(frac(START_TIME)<maketime($(vStartHour)),maketime($(vStartHour))-frac(START_TIME),0),
             if(frac(END_TIME)>maketime($(vEndHour)),frac(END_TIME)-maketime($(vEndHour)),0))*24)) as Overtime ; // Overtime

LOAD *,
            timestamp(StartTime,'MM/DD/YYYY hh:mm:ss TT') as START_TIME,
            timestamp(EndTime,'MM/DD/YYYY hh:mm:ss TT') as END_TIME;
LOAD * Inline [
TicketNo,StartTime, EndTime
1, 8/16/2010 7:00:00 AM, 8/16/2010 7:00:00 PM
2, 8/16/2010 10:00:00 AM, 8/16/2010 1:30:00 PM
3, 8/16/2010 9:00:00 AM, 8/16/2010 2:00:00 PM
4, 8/16/2010 11:00:00 AM, 8/16/2010 1:00:00 PM
5, 8/16/2010 1:15:00 PM, 8/16/2010 1:45:00 PM
6, 8/16/2010 3:00:00 PM, 8/16/2010 7:00:00 PM
7, 8/16/2010 1:30:00 PM, 8/16/2010 6:00:00 PM
8, 8/16/2010 2:00:00 PM, 8/16/2010 7:00:00 PM
9, 8/16/2010 5:00:00 PM, 8/16/2010 6:00:00 PM
10, 8/16/2010 7:00:00 AM, 8/16/2010 1:00:00 PM
11, 8/16/2010 9:30:00 AM,8/16/2010 11:00:00 AM
12, 8/16/2010 1:00:00 PM, 8/16/2010 1:34:00 PM
13, 8/16/2010 2:00:00 PM, 8/17/2010 7:00:00 PM
14, 8/16/2010 1:00:00 PM, 8/17/2010 6:00:00 PM
15, 8/16/2010 9:00:00 AM, 8/17/2010 1:00:00 PM
16, 8/16/2010 3:30:00 PM,8/17/2010 2:00:00 PM
17, 8/16/2010 7:00:00 AM, 8/17/2010 5:00:00 PM
18, 8/17/2010 10:00:00 AM, 8/19/2010 5:00:00 PM
19, 8/17/2010 3:00:00 PM, 8/19/2010 4:00:00 PM
20, 8/19/2010 1:00:00 PM, 8/24/2010 11:00:00 AM
];
Please refer to the attached applications.
Please feel free to share any suggestions.
-
Example of Selecting Multiple Field Values
In this post, I will demonstrate how to programmatically select multiple values in a field.We know that manually, we can select multiple field values ... Show MoreIn this post, I will demonstrate how to programmatically select multiple values in a field.
We know that manually, we can select multiple field values by pressing down on the Ctrl button and selecting the values in the field one at a time.
Screenshot of two values selected in the Year field:
There may be times when you have a requirement to pre-select multiple values programmatically, for example the current and previous months need to be selected when the document is opened.
Selecting multiple field values can be done through Actions.
The following steps illustrate how to add an Action to select 2013 and 2014 values in the Year field for a button (Actions can be added to other objects, such as the Sheet, Document, etc.):
- Go to the Properties of the button object
- Navigate to the Actions tab and add a new Action
- Choose the Selection for Action Type and choose Select in Field for Action
- In the Field textbox, enter the field name, in this example Year
- In the Search String textbox, enter the values to be selected, separated by the vertical bar | and enclosed in parentheses (), in this example (2013|2014)
The following screenshot illustrates the values 2013 and 2014 for the Year field:
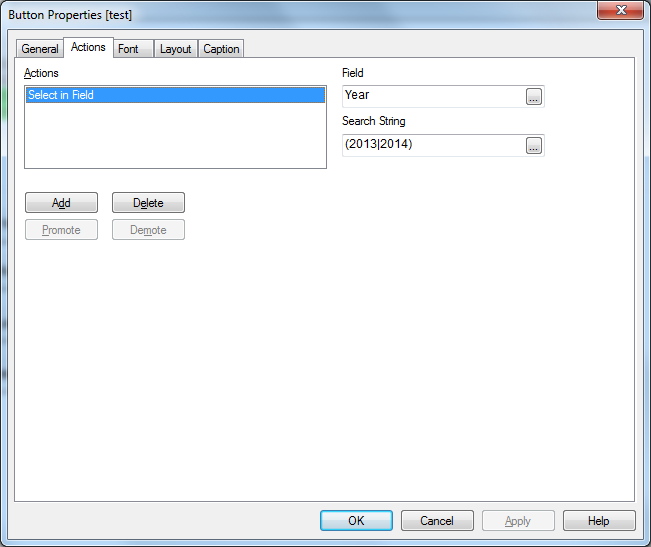
When you press on the button, both 2013 and 2014 values should be selected together in the Year field.
Using Expressions:
The search string can also take expressions using the following syntax:
='(' & Expression1 & '|' & Expression2 & ')'
An example of using an expression to determine last and next month from today’s month:
='(' & Month(AddMonths(Date(Today()), -1)) & '|' & Month(AddMonths(Date(Today()), +1)) & ')'
An example of using variables for current and previous months:
='(' & $(vCurrentMonth) & '|' & $(vPreviousMonth) & ')'
Sample Application:
This post includes a sample application that illustrates a few options for selecting multiple values in a field.
Hope this post was helpful to you.
-
Standard Deviation (Population vs. Sample)
Inspired by swuehl's response here: Help with Standard deviation Full population No... | Qlik Community I thought it make sense to share a way to cal... Show MoreInspired by swuehl's response here: Help with Standard deviation Full population No... | Qlik Community I thought it make sense to share a way to calculate population standard deviation as QlikView's Stdev() seems to be a sample standard deviation. The difference between the two becomes negligible as the number of data point increases, but there might be a use case to apply population standard deviation for a smaller dataset.
I start with no dimension in an Excel file
If you look at the statestic box, you will see that the standard deviation will show the sample stdev number
Also, when you use =Stdev(Data1), it will show the same number as above. In order to get population stdev, all you need to do is to multiple the standard deviation with this
=Stdev(Data1) * sqrt((Count(Data1)-1)/Count(Data1))
In other words, I am multiplying the Sample standard deviation with Sqrt((Number of Observations - 1)/Number of observations). So, for the above sample it would be Sqrt(9/10).
And the same logic can be carry forward to a table to create confidence intervals using TOTAL qualifer
Sample
=Stdev(TOTAL Data1)
Population
=Stdev(TOTAL Data1) * sqrt((Count(TOTAL Data1)-1)/Count(TOTAL Data1))
Same idea can be applied if you want to calculate Sample or Population Standard Deviation by Dimension
In the a chart, you can use these expressions
Sample
=Stdev(TOTAL <Region> Data3)
Population
=Stdev(TOTAL <Region> Data3) * sqrt((Count(TOTAL <Region> Data3)-1)/Count(TOTAL <Region> Data3))
-
QlikView Task Analysis
OverviewFor those of us that work with QlikView distribution service, either the standard version or Publisher then perhaps this model may be of some ... Show MoreOverview
For those of us that work with QlikView distribution service, either the standard version or Publisher then perhaps this model may be of some use in analysis of your tasks.
As a Qlik partner, I developed this to read in the various .xml files created by the distribution service and help look for some common problems such as:
- repetitive failures (TASKS and RELIABILITY - top left and middle charts)
- broken tasks / missing files (ISSUES - top right)
- resource contention (TASK EXECUTION - main chart)
There are lots of clever ways of analysing the QVPR data, including through the Governance dashboard, however I went with this approach as it gave me something tangible and reasonably simple to interpret and then present to a client.
Instructions
- Open the model in QlikView (preferably on the QlikView server)
- Navigate to the Configuration tab
- Update the file locations
- Click the Reload button
- Select the Dashboard tab and start your analysis
Considerations
- Tasks with multiple short reloads may not be easily visible in the gantt chart
- The Gantt chart works best with a single day selected
- Colour conventions are red is bad, green is good and orange is a warning.
I have used in a mix of QlikView 11 and 12 environments using both Publisher and the standard distribution service though I can't account for all environments so the model is provided as is where is, though please feel free to expand for your own use or provide some feedback that may benefit the community.
Thanks for taking the time to read this and I hope you find it useful.
-
Generic keys
Generic Keys is a way to define keys between tables in a more general way so that their values can represent other things than individual key values; ... Show MoreGeneric Keys is a way to define keys between tables in a more general way so that their values can represent other things than individual key values; they can represent groups of key values or any key value. As an example, you can combine product IDs, product group IDs and a symbol for all products into one key field.
You can use generic keys to solve many data modeling problems:
- Authorization table with OR-logic between fields
If you have an authorization table you sometimes want to have a slightly more complex access restriction than a simple logical AND between fields. It could be e.g., that a user is allowed to see sales for all regions for a specific product and at the same time the European sales for all products. Generic keys can be used here. - Mixed dimensional granularity in a single fact table
Often you want to compare actual numbers with budget numbers. The standard method is to concatenate these two tables into one common fact table. However, this new fact table could have mixed granularity in many of the dimensions. Generic keys can be used here. - Multiple fact tables linked using a master link table
Sometimes you have fact tables that are so different that you don’t want to concatenate them. To solve this problem you can make a data model that has a central link table and uses generic keys.
See more in the attached files.
PS I have been asked to make an example on comparing budget and actual numbers, so here it comes as a second attachment. It is a zip file with a mock-up order database with a budget. Create a new empty qvw; expand the zipped files in the same folder as the qvw; insert one of the two included script files into the qvw and run the script.
- Authorization table with OR-logic between fields
-
Extract data from a QlikView Application to QVD or CSV
Here is an easy approach to extracting the data model from a QlikView (QVW) file. The example documented uses QlikView Desktop, if you are using Qlik ... Show MoreHere is an easy approach to extracting the data model from a QlikView (QVW) file. The example documented uses QlikView Desktop, if you are using Qlik Sense then please click here.
Why would you use or need this kind of technique?
In a production environment you may find use of the output table script elements without the variables as they can be useful in load processes when transformed QVDs can be re-used by other applications. However, there are many times where you need to create something quickly for an ad-hoc piece of work or as a demonstration to show a customer with amended data to make it more relevant (changing product, department names etc). This approach can also be useful when working offline on the front end or application tuning where you do not want to deal with all of the complications of the ETL process.
Step 1 - Enter the file name and path for the QVW from which you wish to extract data
- Enter the full file path and name for the QVW
- e.g. C:\Demo\Application\Executive Dashboard.qvw
Step 2 - Enter the destination folder path where the extract data will be saved
- Enter the full folder path for the destination folder
- e.g. C:\Demo\Export Data
Step 3 - Select the output format type
- Your choices are either QVD (Qlik's proprietary file store format) or more generic CSV
Step 4 - Save and reload the application
Please note these instructions are also included in the dashboard itself in case you forget where it came from. This is what the dashboard looks like.
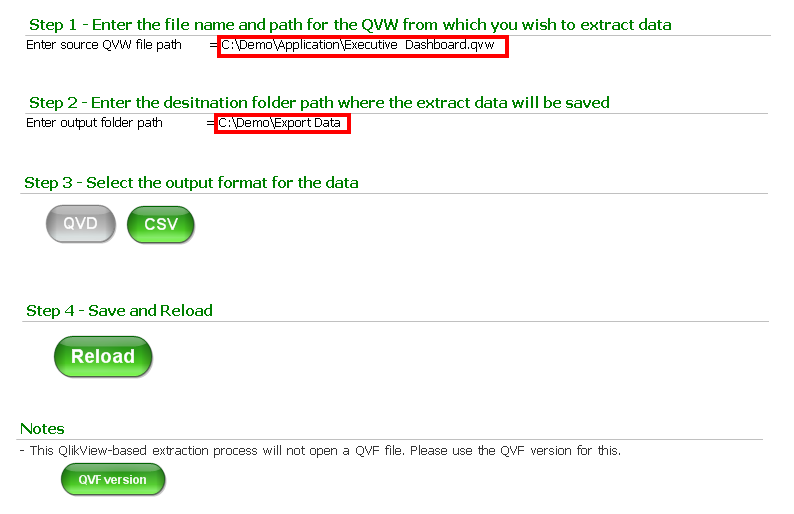
It's as easy as that.
-
Power Tools for QlikView - One-stop-shop
This page will collect all relevant release information about Power Tools for QlikView, and will be continuously updated with each new release and wit... Show MoreThis page will collect all relevant release information about Power Tools for QlikView, and will be continuously updated with each new release and with any patches that are issued. This way we hope for a more consolidated view of the Power Tools suite.
Do you have a feature request or a bug?
- Start a discussion in the QlikView Management or Deployment forums, or
- Email sbn@qlik.com
Latest release
Power Tools 1.3.2 for QlikView
Power Tools 1.3.2 for QlikView - Release Notes
Power Tools 1.3.2 for QlikView - Readme
QlikView 12 compatibility matrix
12.0 12.1 12.2 QlikView Server Agent Yes Yes Yes QlikView Server Super Agent Yes Yes Yes QMSClient Yes Yes Yes Qv User Manager 10 Not yet Not yet Not yet Qv User Manager 11 Not yet Not yet Not yet QvsDetector Yes Yes Yes QvServerObjectConnector Not yet Not yet Not yet ReloadScheduleMigration No No No ServerObjectHandler Yes Yes Yes ServerObjectHandlerBatch Yes Yes Yes SharedFileRepair Not yet Not yet Not yet SharedFileViewer Not yet Not yet Not yet XMLDBViewer Yes Yes Yes Please note that this matrix only describes the compatibility with QlikView 12. It does not indicate whether or not Power Tools are officially supported, because they are not.
SharedFileViewer
Provides insight into the QlikView Server .shared files belonging to .qvw documents. The .shared file stores server data such as server/shared bookmarks, server objects (charts and objects created by a client via the server), annotations and other data that is specific to the document. The tool visualizes the content of the binary .shared file and provides options to "Repair" legacy files, as well as defrag large .shared files.
QvServerObjectConnector
A custom data connector for QlikView that much like the SharedFileViewer provides insight into .shared files, but instead allows to load data straight from .shared files into QlikView documents for analysis. The tool supports extraction of data like ownership, size and type of objects, expressions, annotations, bookmark selections (fields and values) and much more.
QlikView Server Agent
A small service utility that allows easy management of QlikView services. Also allows for quick change of credentials across multiple services at the same time.
QlikView Server Super Agent
A monitoring tool for QlikView Server, that monitors Qv services regardless of version (9+) and reports any service outage with email notifications and/or log files.
QMS API Client
A highly useful tool that gives its user the possibility to interact with the complete setup of QMS API functions in QlikView Server without typing a line of code. Visualizes data structures and enables the user to parameterize and test every function call based on their own data or data from the QMS API.
Qv User Manager
A command-line tool to list, add, remove and edit CAL and user information in a QlikView Server remotely.
QvsDetector
Scans the current subnet for other QlikView Servers and visualizes information like license, root folder, version and such. Also enables certain administrative functions.
Reload Schedule Migration Tool
A small step-by-step instruction tool that helps migrate reload schedules from non-Publisher databases in 9 to Publisher databases in 10 or 11, by manipulating the QVPR database (XML repository required) directly.
Server Object Handler
Enables listing, ownership changing and deletion of server objects in documents hosted on a QlikView Server remotely. Also allows ownership changing to be performed on a selected number of server objects matching a given name pattern.
Server Object Handler Batch
The command-line little brother of the Server Object Handler, that does all the same, but from any command prompt or batch script.
XmlDbViewer
Visualizes and enables searching in and editing of the QlikView Publisher Repository database (QVPR), when in XML format.
Shared File Repair
Uses the upgraded .shared file verify and repair functionality that was re-introduced in QlikView Server (QVS.exe) SR5, by providing a GUI to execute verify/repair operations on one or more .shared files and report the result. Note that even though the verify/repair functionality first came into QVS in 11.20 SR4, this version requires the upgraded functionality in 11.20 SR5.
Frequently Asked Questions
Q: What is a Power Tool?
A: A Power Tool is a small utility program or application that aid in performing a specific functionality or that extends QlikView functionality in some other way.
Q: When should I use a Power Tool?
A: Power Tools should be used when there is a need for functionality that is not in the QlikView product suite already, to evaluate new functionality or when administrative actions outside that is not available as part of the regular program suite might be needed.
Q: Do I need to install any of the tools?
A: No, all tools are, as of this moment, drop-to-deploy tools. Be aware that some of them require resource files outside of the executable itself, like for example configuration files or DLL files. When deploying, make sure to deploy the whole folder and its content.
Q: Do the tools require administrative privileges?
A: Some of them require this, yes. It is up to each tool and its functionality. If you are using UAC (User Account Control) security, make sure to run the tools in privileged mode (right-click and select “Run as Administrator”).
Q: Is there any documentation for the Power Tools?
A: Yes. A limited documentation for the Power Tools is included in each of the separate tools.
Q: Are the Power Tools Supported?
A: No. The Power Tools are not supported and is seen as use-as-is tools, supplied separate from the QlikView product suite. *** Qlik is not responsible for any consequences such as environmental issues, data corruption, configuration errors or unexpected behavior, resulting from the use of Power Tools. ***
Q: Where do I report bugs in the Power Tools?
A: To report a bug, please visit our QlikCommunity Discussion Forums, for example the QlikView Management or QlikView Deploymentforums or send an email to SupportServiceabilityLabs@qlik.com. Bugs will be fixed between releases of the Power Tools entirely at Qlik's discretion.
Older versions
Power Tools 1.3.1
Power Tools 1.3.1 for QlikView
Power Tools 1.3.1 for QlikView - Release Notes
Power Tools 1.3.1 for QlikView - Readme
Power Tools 1.3.0
Power Tools 1.3.0 for QlikView
Power Tools 1.3.0 for QlikView - Release Notes
Power Tools 1.3.0 for QlikView - Readme
Power Tools 1.2
Power Tools 1.2 for QlikView - Release Notes
Power Tools 1.2 for QlikView - Readme
Power Tools 1.1
Power Tools 1.1 for QlikView - Release Notes
Power Tools 1.1 for QlikView - Readme
Power Tools 1.0
-
A Better Ad Hoc Listing
The attached application shows you how to create a data-driven Ad-Hoc listing just using variables. Using a data-driven approach you can also "copy" ... Show MoreThe attached application shows you how to create a data-driven Ad-Hoc listing just using variables. Using a data-driven approach you can also "copy" dimensions and expressions to an Ad-Hoc listing so the user can add additional columns.
An Ad-Hoc listing is a table where the user can choose what dimensions and expressions from the data model are displayed.
This is a very powerful means of examining the data.
Customarily in QlikView this has been done by creating a straight or pivot table and adding all possible expressions and dimensions.
Conditional expressions are added to each dimension and expression so that when the user selects a dimension or expression name from a list box, the associated columns are made visible in the table. This approach has a big drawback: the columns pop up wherever they were defined, not in the order selected. Needless to say this looks very unprofessional. The user shouldn't have to move columns around to fix their listing which was correct when they entered it.
It would be great if an Ad-Hoc listing could be created which preserves the order of selections. To make this data-driven would be an additional plus. This could be done with macros, dynamically creating a table using the API. But macros have a number of drawbacks and essentially Qlik's position is that they should not be used.
The attached application shows you how to create a data-driven Ad-Hoc listing just using variables without any macros.
This approach preserves the order dimensions and expressions appear for a more polished listing.
The user can create an Ad-Hoc listing and then save the listing in a bookmark for later use.
In addition, you can attach icons to every graph and table in your application which will allow the user to apparently "copy" the dimensions and expressions used into an Ad-Hoc listing for detailed analysis.
I'll just provide a cookbook approach to just getting an Ad-Hoc listing working without going into how it's done.
If there's any interest I'll provide some explanation of how it works.
Download the sample application and associated spreadsheet and place them together in the same folder
Explore the application to see how the Ad-Hoc listing works and how a chart can "copy" dimensions and expressions to the listing
To create an Ad-Hoc listing for your own application, see the recipes in the attached document.
-
Aggr() and set analysis: set modifiers inside and / or outside aggr()?!?
Hi community,"Where should the set modifier be placed? Inside and/or outside the aggr()?"The standard answer is mostly:"If you are unsure, you should ... Show MoreHi community,
"Where should the set modifier be placed? Inside and/or outside the aggr()?"
The standard answer is mostly:
"If you are unsure, you should place the set modifiers inside and outside the aggr(). This will probably lead to the desired result..."
I just can't agree. In my opinion it really, really! depends...


Example 1
sum(aggr(sum(F4),F1))
--> default case
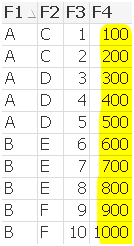
sum(aggr(sum({<F2={"D","E"}>} F4),F1))
--> set modifier at inner aggregation limits F4 values
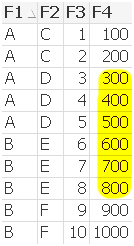
sum({<F2={"D","E"}>} Rangesum(F3,aggr(sum(F4),F1)))
--> set modifier at outer aggregation
--> no difference , because F1={A} exists for F2={D} and F1={B} exists for D2={E}
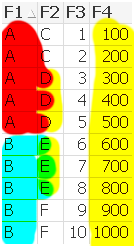
sum({<F2={"D"}>} aggr(sum(F4),F1))
--> set modifier at outer aggregation
--> F1={A} exists for F2={D} and F1={B} doesn‘t exist for D2={E}
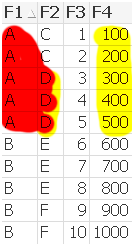
sum({<F2={"D"}>} aggr(sum({<F2={"D"}>}F4),F1))
--> set modifier at inner and outer aggregation
--> F1={A} exists for F2={D} and F1={B} doesn‘t exist for D2={E}
--> set modifier at inner aggregation limits F4 values

Example 2
sum(Rangesum(F3,aggr(sum(F4),F1)))
--> default case
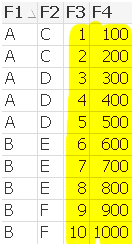
sum(Rangesum(F3,aggr(sum({<F2={"D","E"}>} F4),F1)))
--> set modifier at inner aggregation limits F4 values inside aggr()
--> but doesn’t limit F3 outside aggr()
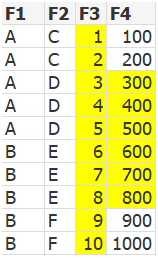
sum({<F2={"D","E"}>} Rangesum(F3,aggr(sum(F4),F1)))
--> set modifier at outer aggregation limits only F3 field, because F1={A} exists for F2={D} and F1={B} exists for D2={E}
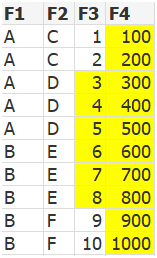
sum({<F2={"D"}>} Rangesum(F3,aggr(sum(F4),F1)))
--> set modifier at outer aggregation
--> limits F3 and F4, because F1={A} exists for F2={D} and F1={B} doesn‘t exist for D2={E}

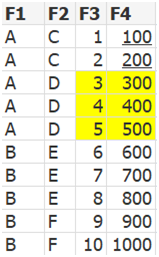
sum({<F2={"D"}>} Rangesum(F3,aggr(sum({<F2={"D"}>} F4),F1)))
--> set modifier at inner and outer aggregation limts F3 and F4 values
Regards
Robin
-
Convert Gauss-Kruger (GK) coordinates to Latitude/Longitude
This article is about converting the GK (Gauss-Krüger) coordinates into WGS 84 (Latitude/Longitude)Background:In cartography, the term Gauss–Krüger Ge... Show MoreThis article is about converting the GK (Gauss-Krüger) coordinates into WGS 84 (Latitude/Longitude)
Background:
In cartography, the term Gauss–Krüger Geographic coordinate system is named after Carl Friedrich Gauss (1777-1855) and Johann Heinrich Louis Krüger. It is a particular set of transverse Mercator projections (map projections) used in narrow zones in Europe and South America, at least in Germany, Turkey, Austria, Slovenia, Croatia, Macedonia, Finland and Argentina. This Gauss–Krüger system is similar to the universal transverse Mercator system (UTM), but the central meridians of the Gauss–Krüger zones are only 3° apart, as opposed to 6° in UTM. Depending on the zone of the Gauss-Kruger coordinates, different EPSG codes are applicable (The country of Germany is within the EPSG-Codes 31466 to 31469). Nevermind about the EPSG code, the below conversion works on any Gauss-Kruger coordinates.
The typical Gauss-Krüger coordinates is a pair of "Rechtswert" (East) and "Hochwert" (North) coordinates, both numbers are 7 digits long, may have up to 3 decimals (since the unit is meter, decimals don't make much sense as they are about decimeters, centimeters, even millimeter).
Links:
- An online translater example is here: WGS84 L�nge/Breite oder Gau�-Kr�ger nach MGRS :: Geograph Deutschland
It supports even http-get requests. - I would not have been able to solve this without this How-To Excel. http://www.kram.de/pca/koordinatenumrechnung.xls Thanks to the author!
- http://en.wikipedia.org/wiki/Gauss%E2%80%93Kr%C3%BCger_coordinate_system
- DE:Gauß-Krüger - OpenStreetMap Wiki (in German)
Solution:
Enough about the background, to convert given set of Gauss-Krüger coordinates from a given "Rechtswert" (East) and "Hochwert" (North) in QlikView add the following script fragments. Adjust the values of XCOORD_Field and Y_COORD Field with the effective column names in which the GK values are found in the later LOAD statement.
// constants
LET XCOORD_Field = 'XKOORD';
LET YCOORD_Field = 'YKOORD';
// Formulas
SET @rho = 57.29577951; //=180/PISET @e2 = 0.006719219;
SET @b1 = "($(YCOORD_Field)/10000855.7646)";
SET @b2 = "Pow($(@b1),2)";
SET @bf = "325632.08677*$(@b1)*((((((0.00000562025*$(@b2)-0.0000436398)*$(@b2)+0.00022976983)*$(@b2)-0.00113566119)
*$(@b2)+0.00424914906)*$(@b2)-0.00831729565)*$(@b2)+1) / 3600/ $(@rho)";
SET @fa = "(($(XCOORD_Field)-(Floor($(XCOORD_Field)/1000000)*1000000)-500000)/(6398786.849/Sqrt(1+(Pow(COS($(@bf)),2)*$(@e2)))))";
SET @LAT_Formula = "($(@bf)-(Pow($(@fa),2)*(Sin($(@bf))/Cos($(@bf)))*(1+(Pow(COS($(@bf)),2) * $(@e2)))/2)
+(Pow($(@fa),4)*(Sin($(@bf))/Cos($(@bf)))*(5+(3*Pow(Sin($(@bf))/Cos($(@bf)),2))+(6*(Pow(COS($(@bf)),2)
* $(@e2)))-(6*(Pow(COS($(@bf)),2) * $(@e2))*Pow(Sin($(@bf))/Cos($(@bf)),2)))/24)) * $(@rho)";
SET @LON_Formula = "(($(@fa)-(Pow($(@fa),3)*(1+(2*Pow(Sin($(@bf))/Cos($(@bf)),2))+(Pow(COS($(@bf)),2)
* $(@e2)))/6)+(Pow($(@fa),5)*(1+(28*Pow(Sin($(@bf))/Cos($(@bf)),2))+(24*Pow(Sin($(@bf))/Cos($(@bf)),4)))/120))
* $(@rho)/COS($(@bf))) + (Floor($(XCOORD_Field)/1000000)*3)";
Now if you import a file or table with Gauss-Krüger coordinates in fields XKOORD / YKOORD this is your script (dark-blue part). If you plan to use QlikView's built-in Mapping Extension "Quick Map" or "QlikView Mapping Extension", the coordinates-pair needs to go into one field, which I am calling LON_LAT. They need to have US number format. use the dark-red part of the script as well.
SET US_Format = "'','.',' '";
LOAD
*
,Num(LON,$(US_Format)) & ',' & Num(LAT,$(US_Format)) AS LON_LAT
;
LOAD
ID
,XKOORD,
,YKOORD
,$(@LAT_Formula) AS LAT
,$(@LON_Formula) AS LON
FROM
[myExcel.xlsx]
(ooxml, embedded labels);
Enjoy,
Christof
- An online translater example is here: WGS84 L�nge/Breite oder Gau�-Kr�ger nach MGRS :: Geograph Deutschland
-
The Fastest Dynamic Calendar Script (Ever)
Me and a colleague have put together a new Calendar, combining a super fast method for generating the needed calendar, while also removing a lot confi... Show MoreMe and a colleague have put together a new Calendar, combining a super fast method for generating the needed calendar, while also removing a lot configuration options in the previous methods.
So if you're using a Min/Max based approach like the one described here: Creating A Master Calendar
Then you're properly used to waiting for the Min/Max to find the largest values in your dataset. This can take minutes. What we have here takes less than a second. I've actually not been able to time this, because this calendar script takes less than a 1 seconds even on billions of rows on decent hardware. The only exception to this is if you use a date range starting before christ and spans a thousand years. If you have a date range, with a lot of holes in it (dates with no data), then you should use the last parameter:
Call Calendar('[Date (NK)]','MyCal','Pre.','','true');
The Attached qvw shows both methods (remember the qvs file).
I've not commented it, because most people will not grasp what is going on anyway, and don't need to
To try it out, include the following in your script, and add this to your code:
Call Calendar('DateField');
/* ************************************************************************************
itelligence Standard Qlik Calender Torben Seebach/Martin Didriksen Special Thanks to Rob Wunderlich and John Witherspoon
Configure Calender parameters
Syntax:
Calendar(DateField[,CalendarName][,Prefix[,Suffix[,FullCalendar]]])
Example:
Call Calendar('Date (NK)','MyCal','Pre.','','true'); // creates a the MyCal table and fields are prefixed with Pre. In the superfast variat
Call Calendar('Date (NK)'); //creates a table called calendar based of "Date (NK)" field
Mandatory:
@_DateField Contains the name of the field to connect the calendar to
Optional:
@_CalendarName Contains the name of the calendar we create
@_CalendarPrefix A Prefix for all fields
@_CalendarSuffix A Suffix for all fields
@_FullCalendar If this contains a value then it creates a calendar with all dates from Min(Date) to Max(Date), default is the slowest option************************************************************************************ */
Sub Calendar (_DateField,_CalendarName,_CalendarPrefix,_CalendarSuffix,_FullCalendar)
Let _StartTime = Now();
Let _CalendarName = If(Len('$(_CalendarName)')=0,'Calendar','$(_CalendarName)');
Let _CalendarPrefix = If(Len('$(_CalendarPrefix)')=0,'','$(_CalendarPrefix)');
Let _CalendarSuffix = If(Len('$(_CalendarSuffix)')=0,'','$(_CalendarSuffix)');
Let _FullCalendar = If(Len('$(_FullCalendar)')=0,1,0);
Let _DateField = PurgeChar(_DateField,'"[]');"$(_CalendarName)":
LOAD
Distinct [$(_DateField)] as [$(_DateField)],
Text(Date([$(_DateField)])) as [$(_CalendarPrefix)DateText$(_CalendarSuffix)],
Year([$(_DateField)]) as [$(_CalendarPrefix)Year$(_CalendarSuffix)],
Week([$(_DateField)])&'-'&Year([$(_DateField)]) as [$(_CalendarPrefix)WeekYear$(_CalendarSuffix)],
Week([$(_DateField)]) as [$(_CalendarPrefix)Week$(_CalendarSuffix)],
Month([$(_DateField)]) as [$(_CalendarPrefix)Month$(_CalendarSuffix)],
Year([$(_DateField)])&'-'&Text(Date([$(_DateField)],'MM')) as [$(_CalendarPrefix)YearMonth$(_CalendarSuffix)], 'Q'&Ceil(Month([$(_DateField)])/3) as [$(_CalendarPrefix)Quarter$(_CalendarSuffix)],
AutoNumber(MonthStart([$(_DateField)]),'_MonthSerial') as [$(_CalendarPrefix)MonthSerial$(_CalendarSuffix)],
AutoNumber(QuarterStart([$(_DateField)]),'_QuarterSerial') as [$(_CalendarPrefix)QuarterSerial$(_CalendarSuffix)],AutoNumber(weekyear([$(_DateField)]) &'|'&week([$(_DateField)]),'_WeekSerial') as [$(_CalendarPrefix)WeekSerial$(_CalendarSuffix)] ;
If _FullCalendar=1 Then
LOAD Date(_DateStart+(Iterno()-1),'$(DateFormat)' ) as [$(_DateField)]
While (_DateStart+(Iterno()-1)<=_DateStop);
LOAD
Floor(Min(Fieldvalue('$(_DateField)',RecNo()))) as _DateStart,
Floor(Max(Fieldvalue('$(_DateField)',RecNo()))) as _DateStop
AUTOGENERATE FieldValueCount('$(_DateField)');
Else
LOAD Num(Fieldvalue('$(_DateField)',RecNo())) as [$(_DateField)]
AUTOGENERATE FieldValueCount('$(_DateField)');
End If/* clean variables */
Let _TotalTime = Round((Now()-_StartTime)*60*60*24,0.00000000001);
Let _StartTime = NULL;
Let _vDateStart = NULL;
Let _vDateStop = NULL;
Trace $(_CalendarName) created in: $(_TotalTime) seconds;
Let _TotalTime = NULL;ENDSUB
Updated 2014-05-23:
- Implement preceding load method suggested by Rob Wunderlich
- Fixed Timer to show seconds
- Corrected error in documentation
- Added PurgeChar so [Date A],"Date B" also works.
- Thanks to Stephen Redmond for pointing to a boolean error in line 22
Other than my brilliant Collegue Martin Didriksen, I also want to give John Witherspoon some credit for inspiration on the autogerate method used. I think he was the first who posted it online.
-
Buenas prácticas de Scripting (en español)
El documento adjunto es el apoyo a la charla que me pidió el Qlik User Group Iberia para su reunión del primer aniversario.Se trata de un compendio de... Show MoreEl documento adjunto es el apoyo a la charla que me pidió el Qlik User Group Iberia para su reunión del primer aniversario.
Se trata de un compendio de buenas prácticas de Scripting y está dividido en 5 partes:
- Qlik Deployment Framework
- Arquitectura en 3 capas
- Buenas prácticas enfocadas a la Mejora del Rendimiento
- Buenas prácticas enfocadas a Facilitar el Mantenimiento
- Buenas prácticas en scripting para Incrementar la Velocidad de Desarrollo en la fase de diseño.
El nº de diapositivas está adaptado al limitado tiempo de exposición, por lo que es posible que echéis muchas cosas en falta, aunque trata de cubrir los mínimos esenciales.
La mayoría de las recomendaciones son aplicables tanto a QlikView como a Qlik Sense.
Sentíos libres para hacer cualquier comentario o sugerencia que estiméis oportuno y por supuesto para descargarlo y usarlo como guía en vuestras empresas.
Que lo disfrutéis.


